Sharpe Ratio Indicator (180)
A risk-adjusted returns indicator for Bitcoin that evaluates asset valuation through a Sharpe Ratio calculation over 180 days, providing color-coded insights into market conditions.
Explore 11,183 indicators. Filter beyond the obvious.
Discover the tools that fit the way you trade.
11,183 tools to explore
A risk-adjusted returns indicator for Bitcoin that evaluates asset valuation through a Sharpe Ratio calculation over 180 days, providing color-coded insights into market conditions.
A Sharpe ratio screener that evaluates multiple assets' risk-adjusted returns, categorizing them into valuation zones to help identify investment opportunities.
A multi-timeframe Volume Profile indicator that identifies key trading levels, point of control, and value areas to help traders understand market structure and potential support/resistance zones.
A dynamic Gann analysis indicator that calculates support and resistance levels by using pivot highs and lows with multiple rotation degrees for precise price predictions.
A specialized TradingView indicator that highlights the 18:00 candle on financial charts, providing visual emphasis on specific trading timeframe and price movements.
NVT Z-Score analyzes market valuation by calculating the Network Value to Transaction ratio and standardizing its deviation through Z-score methodology.
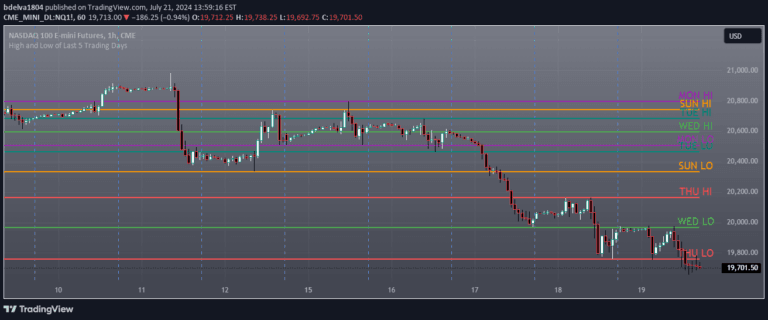
A visual tool that plots high and low price levels from the last 5 trading days, helping traders identify key support and resistance zones across recent market action.
A candlestick pattern indicator identifying multiple bullish and bearish formations through analyzing candle characteristics like size, fullness, and relative positioning.
A trading indicator analyzing 180 USDT perpetual coins using RSI and TSI values, providing insights into potential market movements and short opportunities.
W.D. Gann's time-based trading technique analyzes specific market intervals to identify potential trend reversals and key price cycle points.
Multi-Period Rolling VWAP tracks volume-weighted average price across 7 different timeframes, offering comprehensive price trend analysis with customizable visualization.
A Bitcoin support bands indicator using moving averages to identify key support zones across three levels, helping traders visualize potential entry and reaccumulation points during market corrections.
Likes, views, and comments are historical TradingView snapshots. They describe attention, not trading performance.