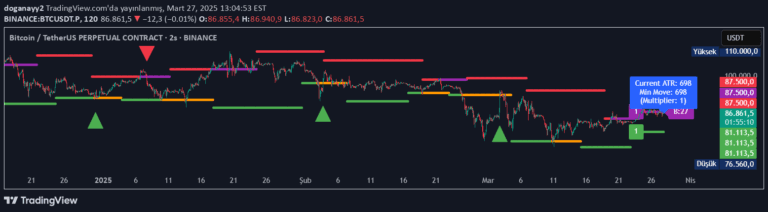
Camarilla Pivot Points indicator that automatically calculates and suggests trading plays using daily pivot levels, providing entry, stop-loss, and target points for traders.
Explore complementary indicator rolesHow it works
The Camarilla Pivot Points indicator calculates specific pivot levels using daily price data, focusing on the 3rd, 4th, and 6th levels for trading plays. It automatically evaluates entry and exit conditions in real-time, generating 12 possible plays divided into two groups based on market range conditions.
The system switches between Regular Trading Hours (RTH) and Extended Trading Hours (ETH) data automatically, using sophisticated algorithms to determine the most appropriate pivot calculations. It provides visual representations of support and resistance levels, with plays color-coded and labeled to indicate potential trading opportunities.
Why it may be useful
This indicator provides traders with a systematic approach to identifying potential trading opportunities based on precise pivot point calculations. By offering predefined entry, stop-loss, and target levels, it helps traders make more objective and structured trading decisions, reducing emotional trading and providing clear risk management guidelines.
The Camarilla Pivot Points system offers flexibility across different markets, including stocks and futures, with configurable settings that allow traders to customize the indicator to their specific trading style and preferences. Its ability to automatically adapt to different market conditions makes it a valuable tool for traders seeking structured and data-driven trading strategies.
When to explore it
The Camarilla Pivot Points indicator is most effective for day traders and scalpers operating in liquid markets with clear intraday price movements. It works best during regular trading hours when price volatility is highest and market participation is most active. Traders should use this indicator when seeking precise entry and exit points based on mathematically derived pivot levels.
The system is particularly useful in markets with consistent daily trading patterns, such as popular stocks and futures contracts. Traders should combine this indicator with other technical analysis tools and confirm signals with additional market analysis to improve overall trading effectiveness and reduce false signal risks.
Keep exploring
What we’ve verified
Access, alerts and repainting behaviour have not been independently verified for this indicator. Check the creator’s current publication and settings.
General descriptions and classifications are recovered research. Verified details above identify the specific checks we have completed. Check the creator’s current publication for later changes.