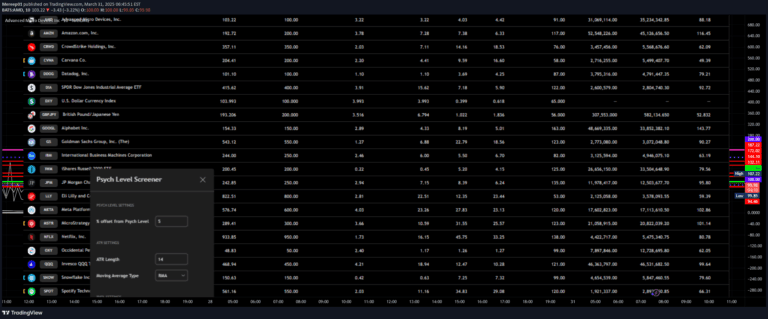
A comprehensive pivot point indicator that displays multiple timeframe pivot levels, including daily, weekly, and monthly pivot points with various calculation methods.
Explore complementary indicator rolesHow it works
The pivot points script calculates multiple types of pivot levels across different timeframes, including standard and Camarilla pivot points. It generates pivot levels for daily, weekly, and monthly periods, creating visual reference points for traders to understand potential support and resistance zones.
The indicator plots these pivot levels directly on the price chart, using different colors to distinguish between pivot types and timeframes. By displaying various pivot calculations simultaneously, traders can gain a comprehensive view of potential price interaction points across different market contexts.
Why it may be useful
Pivot points provide traders with critical price levels that can indicate potential market reversals, support, and resistance zones. These levels are mathematically derived from previous period's price action, offering objective reference points that can help traders make more informed trading decisions.
By presenting multiple timeframe and pivot calculation methods, this script enhances a trader's ability to identify key market levels. The multi-timeframe approach allows traders to understand potential price interactions across different market perspectives, improving strategic decision-making.
When to explore it
This pivot point indicator is most effective in range-bound or trending markets where price tends to respect key support and resistance levels. Traders can use these pivot points to identify potential entry and exit points, set stop-loss levels, and gauge overall market sentiment.
The script is particularly useful for day traders and swing traders who rely on technical levels for their trading strategies. By providing pivot points across daily, weekly, and monthly timeframes, traders can develop a more comprehensive understanding of potential price movements and market dynamics.
Keep exploring
What we’ve verified
Access, alerts and repainting behaviour have not been independently verified for this indicator. Check the creator’s current publication and settings.
General descriptions and classifications are recovered research. Verified details above identify the specific checks we have completed. Check the creator’s current publication for later changes.