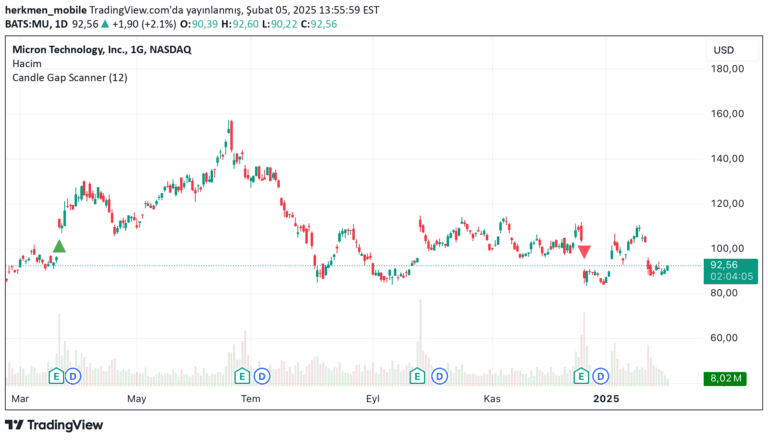
A technical analysis tool that identifies large price candles and calculates Fibonacci retracement levels to help traders find potential support and resistance zones based on market volatility.
Explore complementary indicator rolesHow it works
The Candles Fib indicator first uses Average True Range (ATR) to measure market volatility and identify large candles. A candle is considered large when its true range is at least twice the ATR, which helps filter out smaller, less significant price movements.
Once a large candle is identified, the indicator calculates key Fibonacci retracement levels at 0.50 and 0.618. These levels are automatically plotted as horizontal lines on the chart, extending dynamically as new candlesticks form, allowing traders to observe real-time market reactions to these potential support and resistance zones.
Why it may be useful
The Candles Fib indicator provides traders with a dynamic and objective method for identifying potential support and resistance levels. By combining volatility analysis through ATR with Fibonacci retracement levels, traders can gain insights into possible price reversals and trend continuation points.
This approach helps traders make more informed decisions by highlighting key price levels based on recent market behavior. The indicator's ability to adapt to changing market conditions and automatically update its levels makes it a valuable tool for understanding price dynamics and potential trading opportunities.
When to explore it
The Candles Fib indicator is most effective in markets with clear directional movements and sufficient volatility. It works particularly well in trending markets where price tends to respect Fibonacci retracement levels and show predictable bounce or reversal patterns.
Traders should use this indicator in conjunction with other technical analysis tools to confirm signals and reduce false positives. It is especially useful for identifying potential entry and exit points in various timeframes, from short-term scalping to longer-term swing trading strategies.
Keep exploring
What we’ve verified
Access, alerts and repainting behaviour have not been independently verified for this indicator. Check the creator’s current publication and settings.
General descriptions and classifications are recovered research. Verified details above identify the specific checks we have completed. Check the creator’s current publication for later changes.