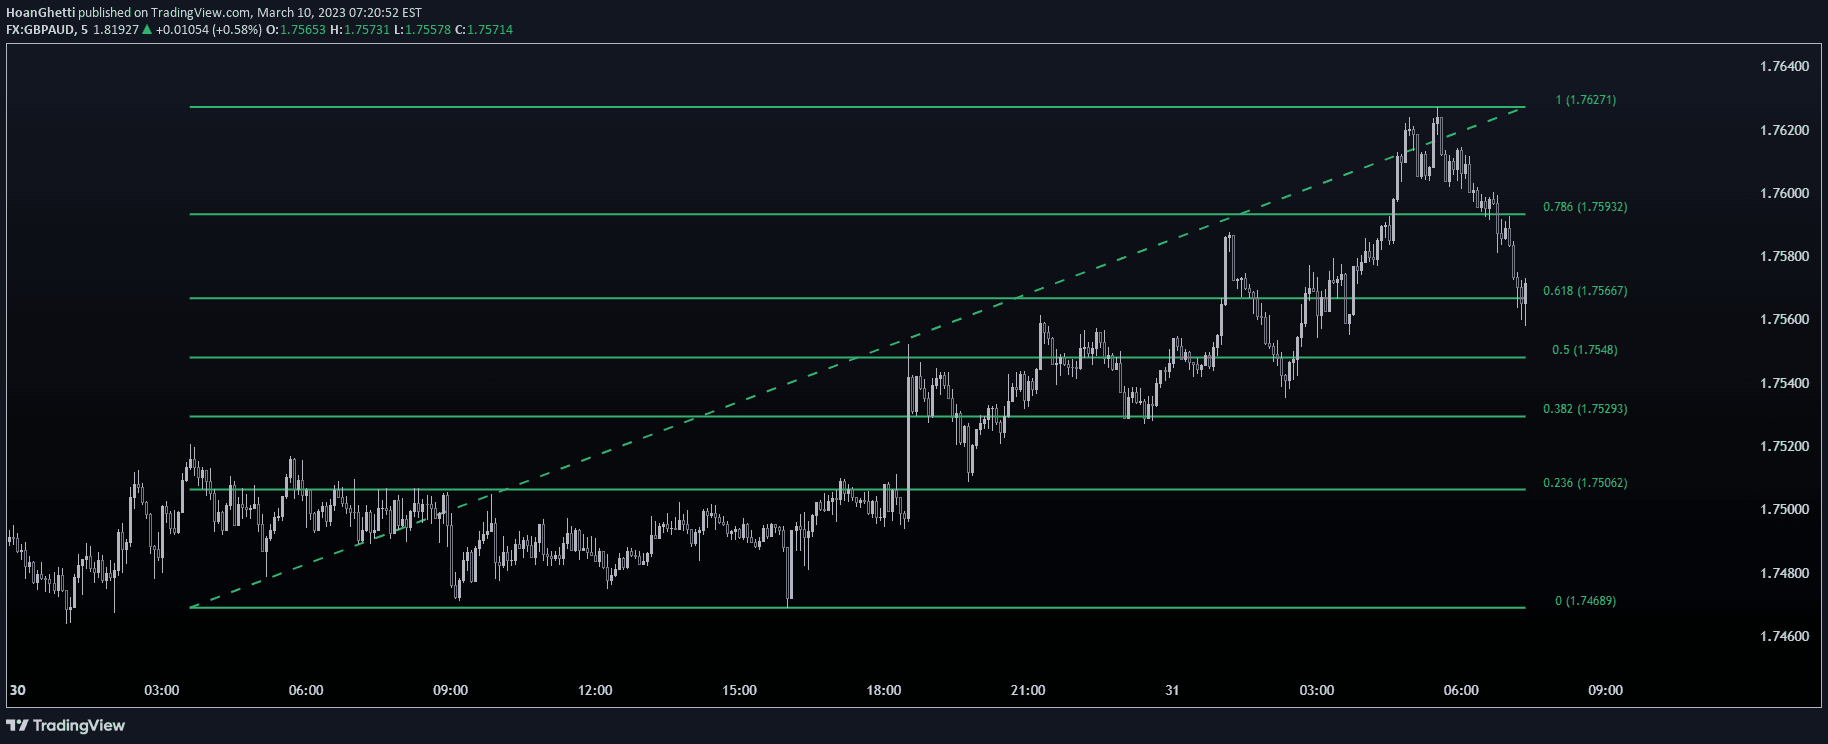
A Fibonacci retracement tool that identifies key pivot points and draws levels for both bullish and bearish price movements, helping traders analyze potential support and resistance zones.
Explore complementary indicator rolesHow it works
The indicator automatically identifies significant pivot points in price movements using a customizable deviation multiplier and depth setting. It creates Fibonacci retracement levels for both upward (bullish) and downward (bearish) price trends, plotting key levels at 0, 0.236, 0.382, 0.5, 0.618, 0.786, and 1.
By analyzing the price action between a significant low and high point, the tool calculates horizontal lines that represent potential support and resistance zones. Traders can customize the sensitivity of pivot point detection and choose how the Fibonacci levels are displayed, including options for extending lines and adjusting label visibility.
Why it may be useful
Fibonacci retracement levels provide traders with a powerful tool for identifying potential price reversal or continuation zones based on mathematical relationships observed in market movements. By offering both bullish and bearish perspectives, the indicator helps traders understand potential support and resistance levels across different market conditions.
The flexibility of customizing pivot detection, line extensions, and level visibility allows traders to adapt the tool to various trading styles and market environments. This versatility makes it valuable for analyzing price action and making more informed trading decisions across different timeframes and asset classes.
When to explore it
This Fibonacci retracement tool is most effective in markets with clear trending behavior, where distinct price swings can be identified. It works best in markets with sufficient historical data, allowing for more accurate pivot point detection and level calculation. Traders should use it in conjunction with other technical analysis tools to confirm potential entry and exit points.
The indicator is particularly useful during trending markets, whether in bullish or bearish conditions, and can help traders identify potential retracement levels before trend continuation or reversal. It's especially valuable for traders looking to pinpoint precise support and resistance zones and understand the potential price movement based on Fibonacci relationships.
Keep exploring
What we’ve verified
Access, alerts and repainting behaviour have not been independently verified for this indicator. Check the creator’s current publication and settings.
General descriptions and classifications are recovered research. Verified details above identify the specific checks we have completed. Check the creator’s current publication for later changes.