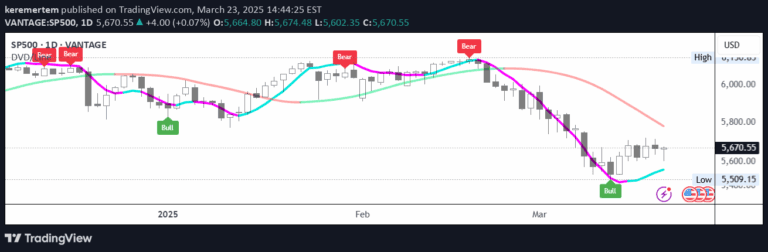
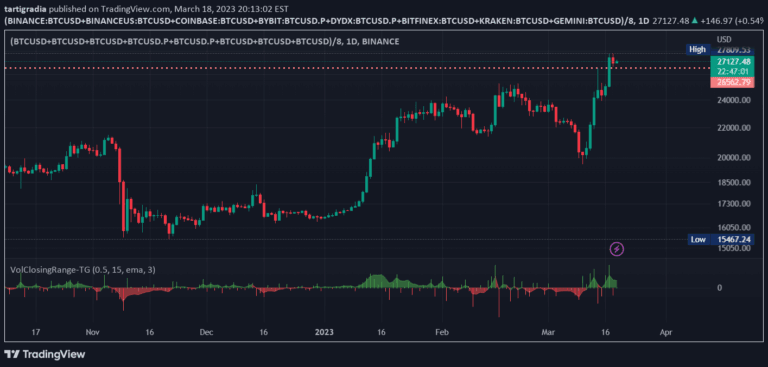
A custom scalping indicator that analyzes price position within a candle and volume changes to generate trading signals with color-coded insights.
Explore complementary indicator rolesHow it works
The indicator begins by calculating the midpoint of each price candle, determining the closing price's percentage position relative to this midpoint. It then evaluates volume changes by comparing the current volume bar to the previous one and converting the difference into a percentage.
These two calculated percentages are then summed together to create a comprehensive percentage value that can be positive or negative. The indicator uses this combined metric to provide visual feedback, with bullish volume and price action signals highlighted in gold, offering traders an immediate visual representation of potential trading opportunities.
Why it may be useful
This custom indicator provides traders with a nuanced view of market dynamics by combining price positioning and volume momentum into a single, easy-to-interpret signal. By converting complex market movements into a straightforward percentage metric, it helps traders quickly assess potential trade opportunities without getting overwhelmed by multiple technical indicators.
The color-coding system adds an additional layer of visual clarity, allowing traders to instantly recognize bullish signals in gold, which can help reduce decision-making time and improve trade entry precision. This approach transforms raw market data into actionable insights that can be rapidly understood and acted upon.
When to explore it
The indicator is most effective for traders engaged in short-term, high-frequency trading strategies like scalping, where quick decision-making and precise market reading are crucial. It works exceptionally well in markets with clear volume trends and consistent price movements, such as forex, futures, and actively traded stocks.
Traders should be particularly attentive to this indicator during periods of market volatility, when volume and price positioning can provide critical insights into potential trend reversals or momentum shifts. It is especially useful for traders who prefer a dynamic, data-driven approach to market analysis and want a simplified yet comprehensive view of market conditions.
Keep exploring
What we’ve verified
Access, alerts and repainting behaviour have not been independently verified for this indicator. Check the creator’s current publication and settings.
General descriptions and classifications are recovered research. Verified details above identify the specific checks we have completed. Check the creator’s current publication for later changes.