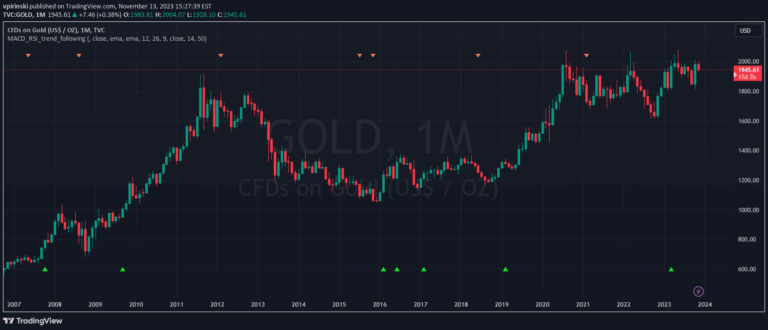
A technical analysis tool using three moving averages and MACD to identify asset trends and momentum, helping traders understand price movement and potential trading signals.
Explore complementary indicator rolesHow it works
The CoffeeShopCrypto 3pl MA indicator employs three moving averages with lengths of 12, 26, and 50 periods, which can be either simple or exponential. These moving averages are color-coded to represent different trend perspectives, with the fast EMA/SMA in yellow, mid EMA/SMA in gray, and slow EMA/SMA changing between green and red based on the overall trend.
Additionally, the indicator calculates the MACD using user-defined fast and slow lengths and a smoothing length for the signal line. The MACD bars are colored based on momentum, indicating whether the histogram is growing or falling and its position relative to the zero line.
Why it may be useful
This indicator provides traders with a comprehensive view of market trends and momentum, helping them make more informed trading decisions. By visualizing multiple moving averages, traders can quickly identify trend direction and potential trend changes, which is crucial for timing entry and exit points.
The MACD component adds depth to the analysis by revealing the underlying momentum of the asset. This helps traders understand not just the trend's direction, but also its strength and potential for continuation or reversal, which can be critical in developing robust trading strategies.
When to explore it
The CoffeeShopCrypto 3pl MA indicator is most effective in markets with clear trends, such as trending cryptocurrencies, stocks, or forex pairs. It works best in timeframes ranging from short-term (minutes) to medium-term (weeks), making it versatile for different trading styles like scalping, day trading, and swing trading.
Traders should use this indicator in conjunction with other technical analysis tools and risk management strategies. It is particularly useful during periods of market volatility, when identifying trend strength and potential momentum shifts can provide a competitive edge in trading decisions.
Keep exploring
What we’ve verified
Access, alerts and repainting behaviour have not been independently verified for this indicator. Check the creator’s current publication and settings.
General descriptions and classifications are recovered research. Verified details above identify the specific checks we have completed. Check the creator’s current publication for later changes.