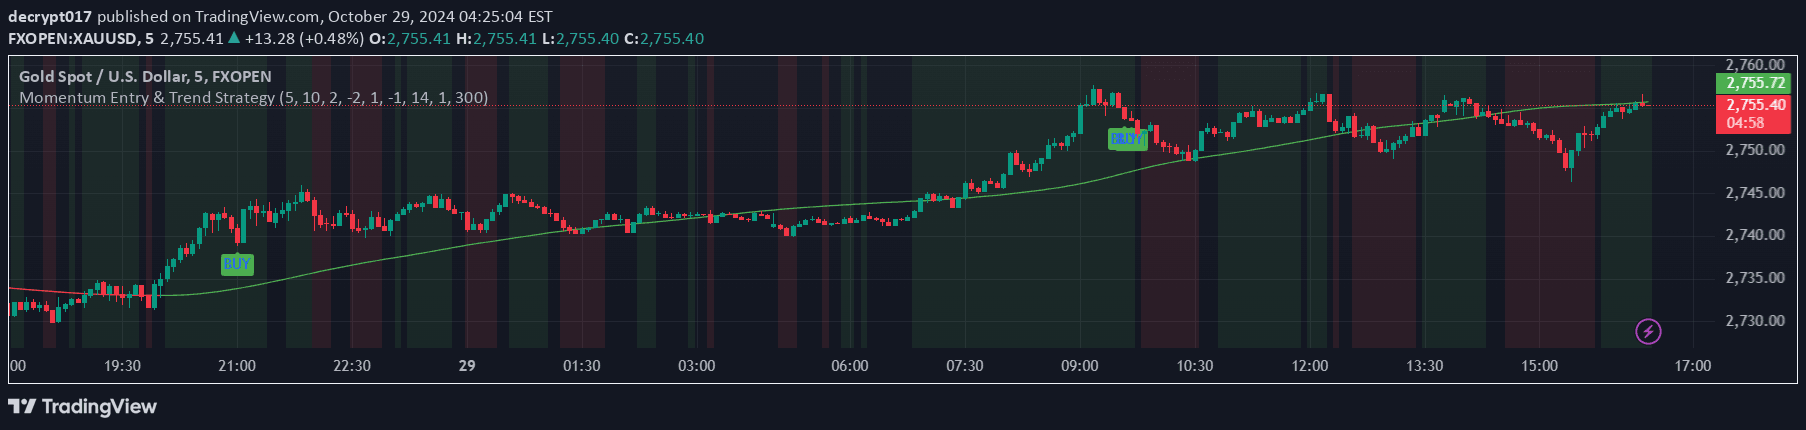
A color-coded market structure indicator that visually represents price movement across three speed bands, helping traders identify market patterns and potential trend changes.
Explore complementary indicator rolesHow it works
The indicator uses three color-coded bands representing different market movement speeds: Reach (fast), Energy (medium), and Basis (slow). Each band is color-coded to represent market dynamics, with intense colors signaling significant market changes.
The colors are derived from KPAM, CCI, and RSI indicators, but the indicator itself is not a direct representation of these metrics. By stacking these bands, the indicator creates a visual representation of market structure that allows traders to quickly understand market momentum and potential trend shifts.
Why it may be useful
This indicator simplifies complex market analysis by transforming numerical data into an intuitive color-based visual representation. It reduces noise in trend analysis, making it easier for traders to quickly identify market patterns and potential trend changes.
By presenting market movement through color-coded bands, the indicator helps traders understand market dynamics at different speeds, from fast volatile movements to slower, broader market trends. This approach allows for more rapid and visually intuitive market structure interpretation.
When to explore it
The indicator works best when traders want a quick, visual understanding of market structure across different timeframes. It is particularly useful when zooming out to get a broader market perspective and identifying areas of intense color changes.
Traders should pay special attention to patterns of intense reds followed by intense greens, which can signal the start of a new market cycle. The indicator is most effective when used in conjunction with other analysis methods and when precision mode is activated to reveal more nuanced market movements.
Keep exploring
What we’ve verified
Access, alerts and repainting behaviour have not been independently verified for this indicator. Check the creator’s current publication and settings.
General descriptions and classifications are recovered research. Verified details above identify the specific checks we have completed. Check the creator’s current publication for later changes.