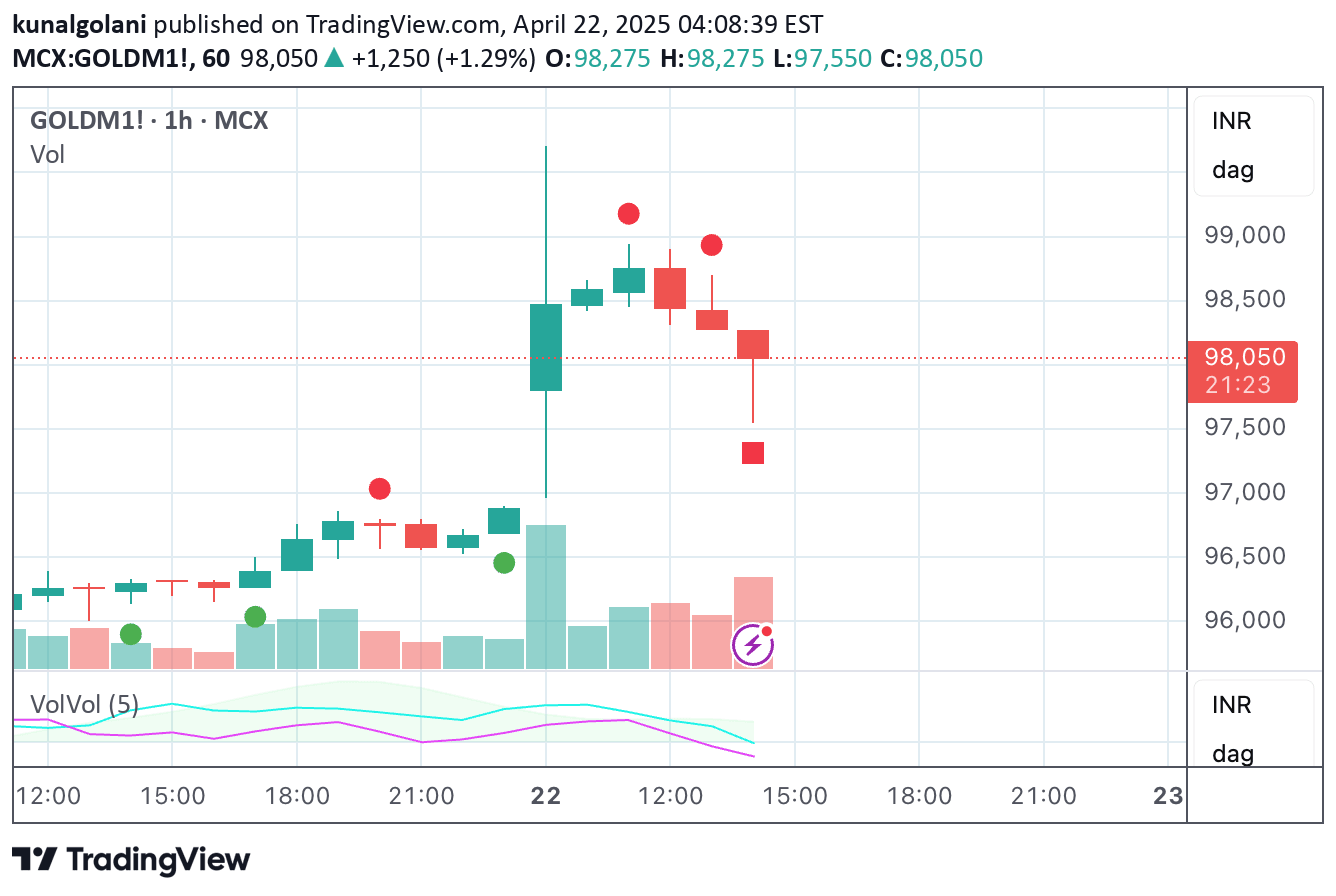
A comprehensive indicator that combines Average True Range (ATR) and trading volume to measure market volatility and participation, providing insights into potential market movements.
Explore complementary indicator rolesHow it works
The Combined ATR + Volume (C-ATR+Vol) indicator calculates market volatility by integrating two key metrics: Average True Range (ATR) and trading volume. It first measures price volatility using ATR, which analyzes the price range over a specified period, indicating the magnitude of price fluctuations. Simultaneously, it tracks trading volume to reflect market participation and trader interest.
The indicator then normalizes both ATR and volume to a 0-100 scale, allowing for direct comparison. By taking the average of these normalized values, it creates a single comprehensive score that represents both price movement and market activity. This approach provides traders with a more nuanced view of market conditions beyond traditional single-metric volatility measurements.
Why it may be useful
This indicator is crucial because it addresses the limitations of using volatility or volume in isolation by combining both metrics into a single, easily interpretable value. Traditional volatility indicators might show significant price movement without confirming substantial market participation, potentially leading to misleading signals.
By integrating ATR and volume, traders can more accurately assess the strength and reliability of market movements. The normalized score helps traders quickly identify market conditions, distinguishing between periods of genuine market activity and those with superficial price changes. This comprehensive approach reduces the risk of making trading decisions based on incomplete information, enabling more informed and strategic market analysis.
When to explore it
The C-ATR+Vol indicator is most effective during periods of potential market transitions or when seeking to confirm trend strength and market participation. Traders should pay special attention when the indicator reaches values above 80, signaling high volatility and strong volume, which often precedes significant market moves or trend continuations. It is particularly useful in identifying potential breakout scenarios or validating the authenticity of emerging price trends.
The indicator is valuable across various market conditions and timeframes, but it shines brightest when used in conjunction with other technical analysis tools. Traders can leverage it to filter out low-conviction market scenarios, focus on high-probability trading opportunities, and develop more robust trading strategies that consider both price movement and market participation.
Keep exploring
What we’ve verified
Access, alerts and repainting behaviour have not been independently verified for this indicator. Check the creator’s current publication and settings.
General descriptions and classifications are recovered research. Verified details above identify the specific checks we have completed. Check the creator’s current publication for later changes.