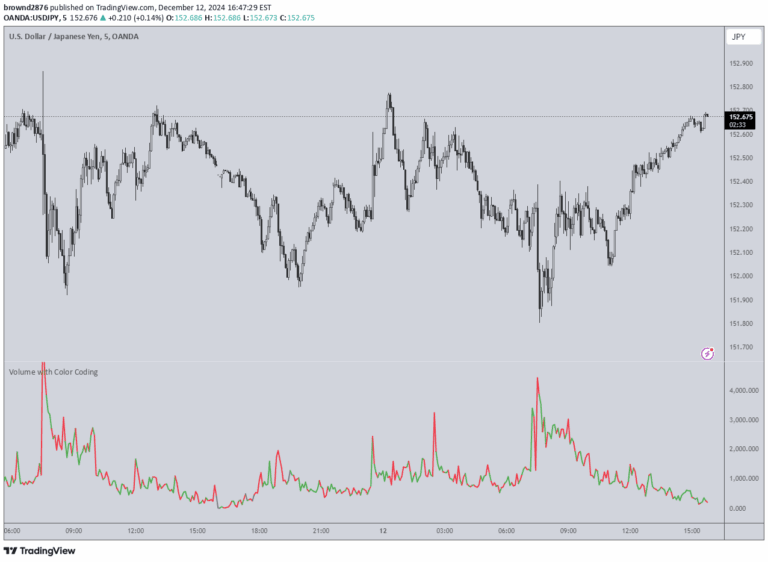
A volume spike indicator that detects significant trading volume increases and color-codes price bars to highlight market activity and potential price movements.
Explore complementary indicator rolesHow it works
The indicator calculates average volume over a specified lookback period and identifies volume spikes when current volume exceeds a defined threshold, typically 10 times the average volume. It uses a dynamic threshold multiplier to detect significant volume breaks, which helps traders quickly recognize periods of intense market activity.
When a volume spike is detected, the indicator color-codes price bars based on price movement. Green bars indicate a volume spike with a price close higher than the previous bar, while red bars show a volume spike with a price close lower than the previous bar. Blue bars signify an extreme volume break, providing visual cues about market dynamics and potential trend changes.
Why it may be useful
Volume spike indicators are crucial for traders because they reveal moments of heightened market interest and potential trend reversals. By highlighting significant volume increases, traders can identify potential entry and exit points, gauge market sentiment, and confirm the strength of price movements.
The color-coding feature provides an intuitive visual representation of price action during high-volume periods, allowing traders to quickly assess market momentum. This approach helps traders make more informed decisions by combining volume analysis with price movement, offering insights into potential market shifts and trading opportunities.
When to explore it
This indicator is most effective during periods of market volatility, such as earnings announcements, economic news releases, or significant market events. It works well across various asset classes, including stocks, forex, and cryptocurrencies, providing valuable insights for traders seeking to understand market dynamics.
Traders can optimize the indicator by adjusting the threshold multiplier and lookback period to suit their specific trading strategy and timeframe. It is particularly useful for intraday and swing traders who rely on volume and price action for making trading decisions, helping them identify potential market turning points and significant price movements.
Keep exploring
What we’ve verified
Access, alerts and repainting behaviour have not been independently verified for this indicator. Check the creator’s current publication and settings.
General descriptions and classifications are recovered research. Verified details above identify the specific checks we have completed. Check the creator’s current publication for later changes.