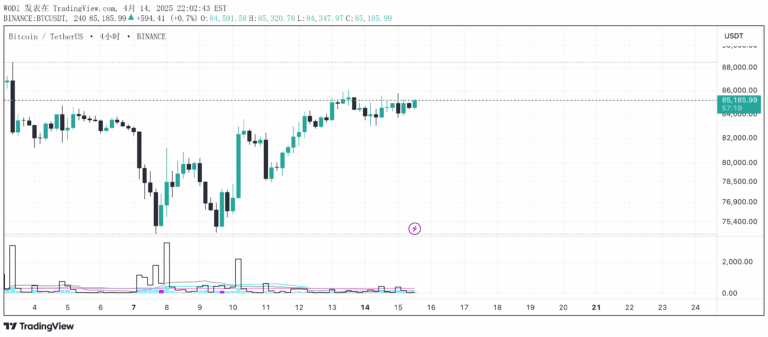
A volume indicator that color-codes trading volume lines to reflect market sentiment, distinguishing between bullish, bearish, and neutral price movements.
Explore complementary indicator rolesHow it works
The volume indicator dynamically colors volume lines based on price action, using green for bullish periods where closing price exceeds opening price, red for bearish periods where closing price is lower than opening price, and gray for neutral periods with equal open and close prices. This color-coding provides an immediate visual representation of market sentiment and volume trends.
By mapping volume against price movement, the indicator helps traders quickly assess the strength and direction of market momentum. The color-coded lines can be accompanied by precise volume labels at specified intervals, offering traders a comprehensive and easy-to-interpret view of trading activity.
Why it may be useful
Volume analysis is crucial for understanding market dynamics, as it reveals the strength behind price movements and potential trend reversals. By color-coding volume lines, traders can instantly recognize whether buying or selling pressure is dominating the market, providing insights into potential future price direction.
The visual representation helps traders make more informed decisions by offering a quick, intuitive snapshot of market sentiment. This approach simplifies complex volume data, allowing traders to quickly assess market conditions without needing to perform detailed manual calculations.
When to explore it
This volume indicator is most effective during periods of significant market activity, such as during earnings reports, economic announcements, or when trading volatile financial instruments. It provides particular value in markets with high trading volumes, where the color-coded representation can quickly reveal shifts in market sentiment.
Traders can utilize this tool across various timeframes, from scalping to swing trading, making it versatile for different trading strategies. It is especially useful when combined with other technical indicators to confirm trend strength, validate potential entry and exit points, and provide additional context to price movement.
Keep exploring
What we’ve verified
Access, alerts and repainting behaviour have not been independently verified for this indicator. Check the creator’s current publication and settings.
General descriptions and classifications are recovered research. Verified details above identify the specific checks we have completed. Check the creator’s current publication for later changes.