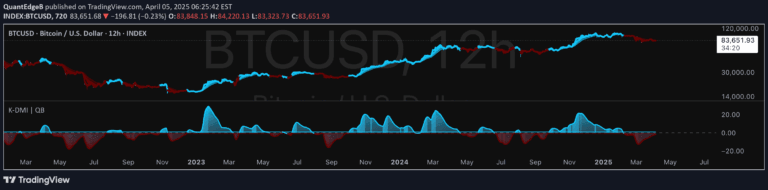
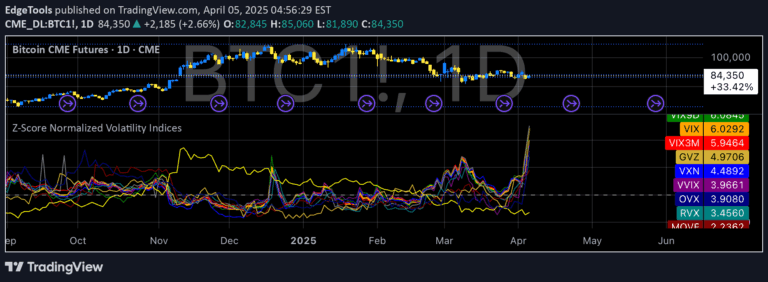
A trading indicator that detects market imbalances across two correlated instruments, helping traders confirm strong price movements and avoid false breakouts.
Explore complementary indicator rolesHow it works
The Correlated Imbalance Detector analyzes price action patterns called 'imbalances' simultaneously on two related financial instruments. It identifies significant price gaps that haven't been filled, which indicate strong buying or selling pressure. The indicator requires both instruments to show matching imbalance patterns, ensuring a more robust signal.
By comparing two correlated markets like ES and NQ futures, the indicator validates market movements through correlation. It uses candlestick direction and imbalance characteristics to generate visual signals, with green squares representing bullish imbalances and red squares indicating bearish imbalances.
Why it may be useful
This indicator provides traders with a more reliable method of identifying genuine market movements by reducing false signals. By requiring confirmation from two correlated instruments, it helps filter out potential fakeouts and noise that can mislead traders in volatile market conditions.
The correlation approach adds an extra layer of validation to trading decisions. The signal's strength lies in its ability to highlight high-probability market moves by examining multiple instruments simultaneously. Traders can use this tool to gain more confidence in their trading bias and make more informed decisions about market entry and exit points.
When to explore it
The Correlated Imbalance Detector works best on higher timeframes like H1 and above, where longer-term market trends are more clearly defined. It is particularly effective when trading correlated instruments such as major indices like ES and NQ futures. Traders should use this indicator as part of a comprehensive market analysis strategy.
The signal is most valuable during periods of clear market trends and when trading instruments with known correlation. Traders should consider the overall market context and use the indicator as a confirmation tool rather than a standalone trading signal. It is especially useful for identifying strong directional moves in more stable market environments.
Keep exploring
What we’ve verified
Access, alerts and repainting behaviour have not been independently verified for this indicator. Check the creator’s current publication and settings.
General descriptions and classifications are recovered research. Verified details above identify the specific checks we have completed. Check the creator’s current publication for later changes.