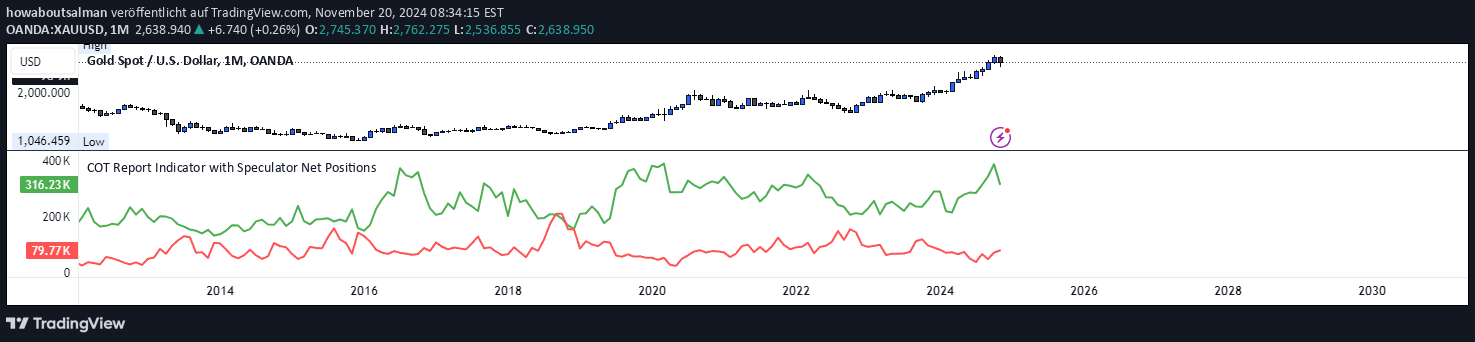
COT Commercials Opposite Positions Table tracks commercial traders' market positions in futures, providing insights into market sentiment across currencies, commodities, and indices.
Explore complementary indicator rolesHow it works
The COT Commercials Opposite Positions Table analyzes the Commitments of Traders (COT) report to display detailed positioning data for commercial market participants. It breaks down long, short, and net positions across different markets, including futures and options for currencies, commodities, indices, and cryptocurrencies.
The indicator generates a comprehensive table with color-coded visualizations that highlight extreme positions and percentage allocations. Traders can observe the historical positioning data for the past 10 weeks, allowing for a deeper understanding of how commercial traders are positioning themselves in specific markets.
Why it may be useful
Commercial traders are typically considered sophisticated market participants with significant resources and insider knowledge about market dynamics. By tracking their positioning, traders can gain valuable insights into potential market trends and sentiment that might not be immediately apparent from price action alone.
The indicator provides a unique perspective on market psychology, showing how professional traders are strategically positioning themselves across different financial instruments. This information can help traders make more informed decisions by understanding the underlying market dynamics and potential future price movements.
When to explore it
The COT Commercials Opposite Positions Table is most effective for swing traders and investors looking to understand long-term market positioning and sentiment. It works best when analyzing futures markets and requires a weekly chart timeframe for accurate interpretation.
Traders should use this indicator as a complementary tool to other technical and fundamental analysis methods. It is particularly useful for identifying potential trend reversals, understanding market sentiment, and gaining insights into how professional traders are positioning themselves across various financial markets.
Keep exploring
What we’ve verified
Access, alerts and repainting behaviour have not been independently verified for this indicator. Check the creator’s current publication and settings.
General descriptions and classifications are recovered research. Verified details above identify the specific checks we have completed. Check the creator’s current publication for later changes.