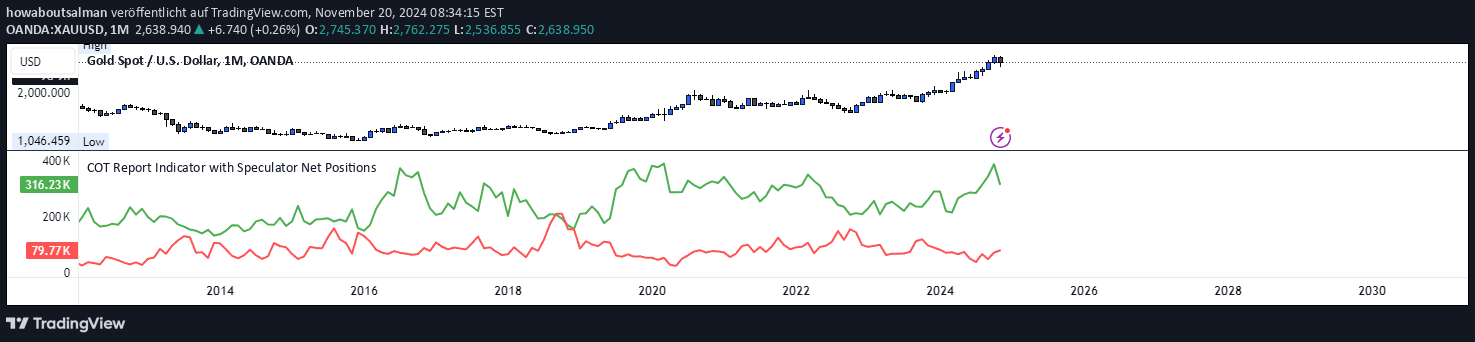
A COT Report Indicator analyzing market sentiment by tracking net positions of different trader categories across various financial instruments and timeframes.
Explore complementary indicator rolesHow it works
The COT Report Indicator tracks the net positions of three primary market participant categories: Commercial, Noncommercial, and Nonreportable traders. By analyzing their long and short positions, the indicator generates visual representations using color-coded lines representing net long positions (green), net short positions (red), and net difference (black).
Users can customize the indicator by selecting specific data types, choosing between futures-only or futures and options data, and setting timeframes that sync with the chart or remain custom. The tool automatically adapts to different financial instruments like gold, crude oil, indices, and forex pairs, providing a comprehensive view of market sentiment.
Why it may be useful
The COT Report Indicator offers traders deep insights into market dynamics by revealing the positioning and sentiment of major market participants. By understanding how commercial entities, speculators, and other traders are positioning themselves, investors can gain a strategic advantage in interpreting potential market movements and trends.
This tool bridges fundamental and technical analysis by providing a unique perspective on market psychology. Traders can use these insights to confirm existing strategies, identify potential trend reversals, and make more informed trading decisions across various financial markets.
When to explore it
The COT Report Indicator is most effective for long-term traders and investors seeking to understand broader market sentiment and potential trend shifts. It is particularly valuable for analyzing markets with significant institutional participation, such as commodities, indices, and major currency pairs.
Traders should recognize that the indicator is best suited for weekly or monthly analysis, as COT data is updated infrequently. It provides maximum value when used in conjunction with other technical and fundamental analysis tools, helping traders confirm trends and make more strategic investment decisions.
Keep exploring
What we’ve verified
Access, alerts and repainting behaviour have not been independently verified for this indicator. Check the creator’s current publication and settings.
General descriptions and classifications are recovered research. Verified details above identify the specific checks we have completed. Check the creator’s current publication for later changes.