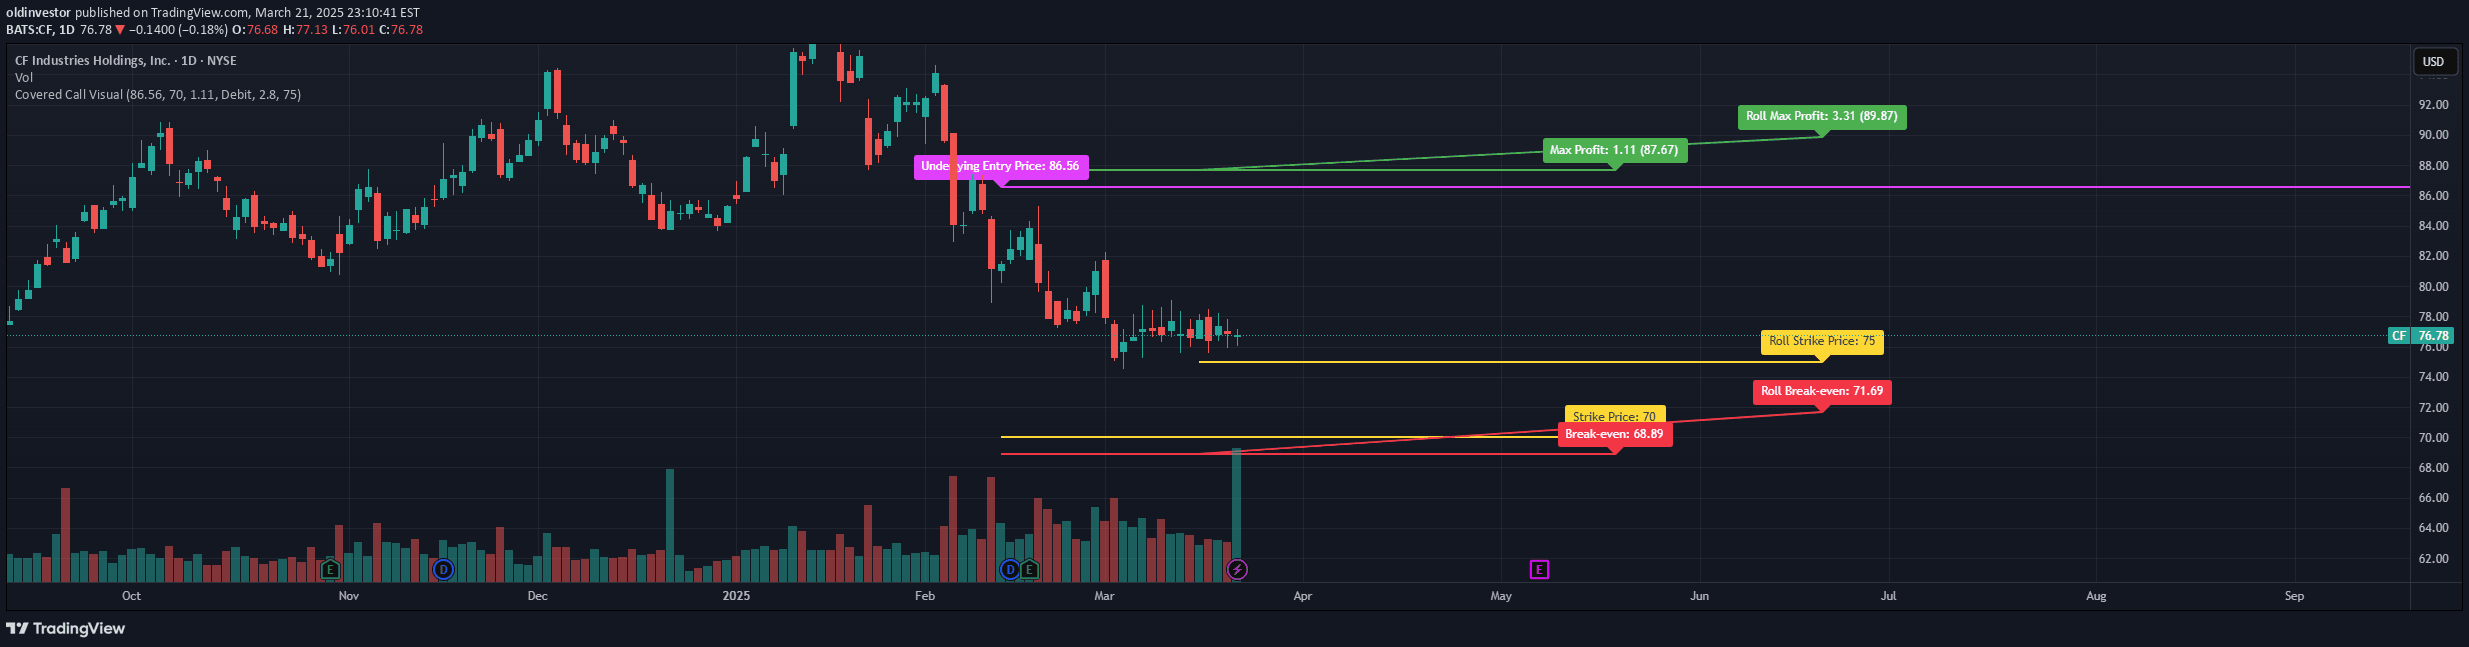
A trading technique visualizing key price levels for covered call options, displaying max profit, entry price, strike price, and break-even points between specified dates.
Explore complementary indicator rolesHow it works
A covered call options strategy involves plotting multiple critical price lines to help traders understand potential outcomes. The chart generates lines representing max profit potential, entry price, strike price, and break-even point based on specific option parameters entered by the trader.
These lines are drawn between the trader's specified entry and expiration dates, providing a visual representation of potential profit and loss scenarios. By mapping out these key price levels, traders can quickly assess the potential risk and reward of their covered call strategy before executing the trade.
Why it may be useful
Covered call strategies are essential for options traders seeking to generate additional income from existing stock positions. By visualizing potential profit scenarios, traders can make more informed decisions about potential option trades and understand their maximum potential gains and losses.
The graphical representation helps traders quickly assess the risk-reward profile of their covered call strategy. This visualization allows for faster decision-making and provides a clear, intuitive understanding of how different price movements might impact the overall trade outcome.
When to explore it
This strategy works best in relatively stable or slightly bullish market conditions where stock prices are not expected to experience significant volatility. Traders typically use covered calls when they own stocks and want to generate additional income through option premium collection.
It is particularly useful for investors looking to enhance their portfolio returns while providing a small hedge against minor price declines. Traders should consider using this approach on stocks they are comfortable holding long-term and where they do not anticipate substantial price appreciation in the near term.
Keep exploring
What we’ve verified
Access, alerts and repainting behaviour have not been independently verified for this indicator. Check the creator’s current publication and settings.
General descriptions and classifications are recovered research. Verified details above identify the specific checks we have completed. Check the creator’s current publication for later changes.