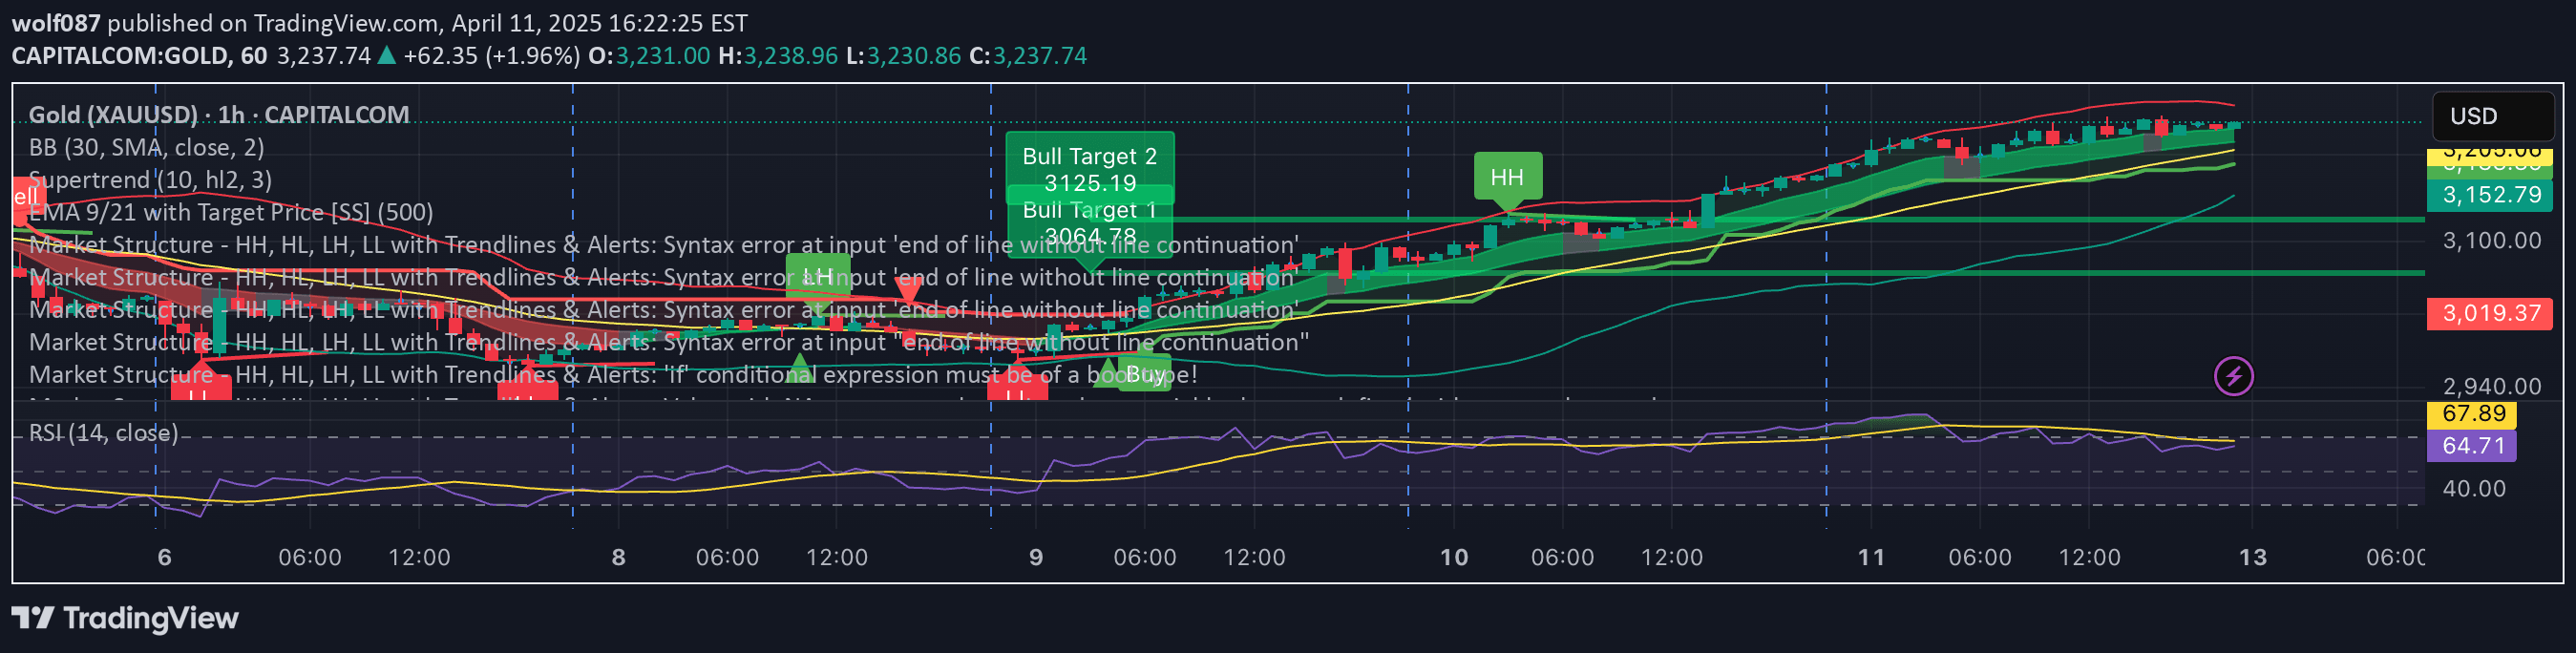
A trading indicator that combines Central Pivot Range (CPR) with Fibonacci ratios to plot support and resistance levels. Helps traders identify potential price reversal and breakout zones.
Explore complementary indicator rolesHow it works
The indicator calculates the daily pivot point by averaging the high, low, and close prices, establishing a central reference point for price analysis. It then derives Fibonacci-based support and resistance levels both above and below this pivot point, using key Fibonacci ratios like 0.382, 0.5, 0.618, 1.0, 1.272, and 1.618.
These levels are plotted as small colored circles directly on the chart, with labels to help traders quickly identify each Fibonacci level. The circles provide visual markers that help traders anticipate potential price interactions, showing where the market might pause, reverse, or break through.
Why it may be useful
This indicator provides traders with a structured approach to understanding potential price movements by leveraging mathematical relationships in market behavior. By combining pivot point calculations with Fibonacci ratios, it offers a systematic method for identifying key support and resistance zones that can guide trading decisions.
The visual representation of these levels makes complex market analysis more accessible, allowing traders to quickly recognize potential entry, exit, and target points. It transforms abstract mathematical concepts into practical trading insights, helping traders make more informed and strategic decisions.
When to explore it
The CPR-Based Fibonacci S/R indicator works best when used in conjunction with other technical analysis tools and strategies. It is particularly effective for traders who want to identify potential reversal or breakout points in both intraday and swing trading scenarios.
Traders should look for additional confirmations such as price action signals, volume indicators, or trendline breaks when using these Fibonacci levels. The indicator is most powerful when applied to liquid markets with clear price structures, and when used as part of a comprehensive trading strategy rather than in isolation.
Keep exploring
What we’ve verified
Access, alerts and repainting behaviour have not been independently verified for this indicator. Check the creator’s current publication and settings.
General descriptions and classifications are recovered research. Verified details above identify the specific checks we have completed. Check the creator’s current publication for later changes.