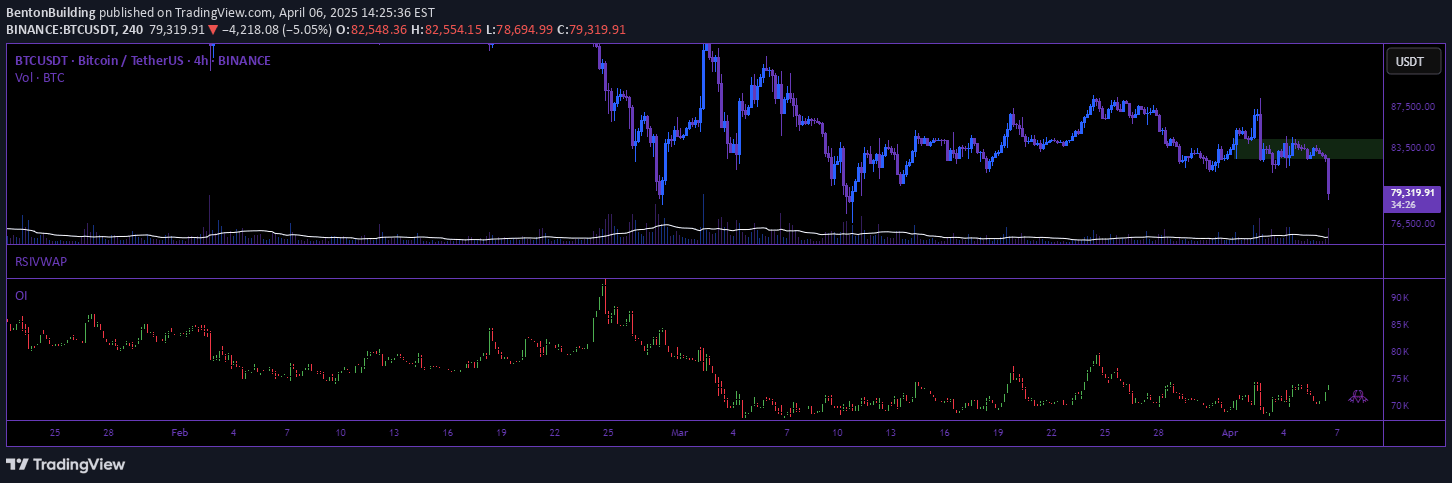
Open Interest indicator for crypto markets tracking long and short positions on Binance, revealing potential market sentiment and trader positioning across different timeframes.
Explore complementary indicator rolesHow it works
Open Interest (OI) tracks the total number of outstanding derivative contracts in a market, representing the aggregate value of active positions. For crypto markets, it specifically measures the total value of open long and short positions on platforms like Binance, allowing traders to understand current market positioning.
The indicator can be viewed in asset-denominated terms (e.g., BTC) or USD-denominated, providing flexibility in analysis. By comparing OI changes alongside price movements, traders can interpret potential market sentiment shifts, such as whether new positions are being opened or existing positions are being closed.
Why it may be useful
Open Interest is crucial for understanding market dynamics and potential future price movements by revealing trader sentiment and positioning. It provides insights into whether market participants are adding to existing trends or potentially preparing for a reversal, which can help traders make more informed decisions.
By tracking OI in relation to price action, traders can gain a deeper understanding of market psychology, identifying whether momentum is building or potentially weakening. This information can be particularly valuable in volatile crypto markets where sentiment can change rapidly.
When to explore it
Open Interest is most effective when used on shorter timeframes like 1-minute charts to identify immediate market dynamics and potential liquidation events. Traders can leverage this indicator during periods of significant price movement to understand whether the trend is being supported by increasing or decreasing market participation.
The signal works best when combined with other technical indicators and price action analysis, providing a more comprehensive view of market conditions. It's particularly useful for traders looking to understand the underlying strength or weakness of a current price trend in cryptocurrency markets.
Keep exploring
What we’ve verified
Access, alerts and repainting behaviour have not been independently verified for this indicator. Check the creator’s current publication and settings.
General descriptions and classifications are recovered research. Verified details above identify the specific checks we have completed. Check the creator’s current publication for later changes.