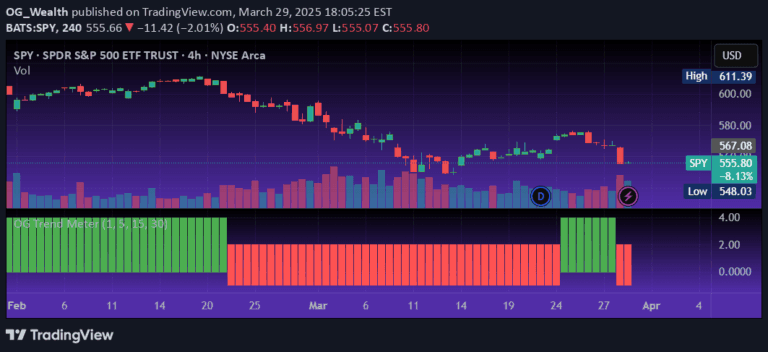
A custom Awesome Oscillator variant that analyzes daily and 4-hour open prices to confirm trend direction using a non-repainting approach with visual histogram representation.
Explore complementary indicator rolesHow it works
The Custom AO with Open Difference Indicator calculates trend direction by comparing the daily open price against the average of six previous 4-hour open prices. It generates an Awesome Oscillator (AO) value that determines market momentum through a histogram representation, with green bars indicating potential upward momentum and red bars suggesting potential downward momentum.
The indicator smooths short-term price variations by using a mean calculation of six 4-hour opens, which helps reduce market noise and provides a more stable basis for trend identification. By focusing on open prices across different timeframes, the indicator offers a unique perspective on market sentiment and potential trend shifts.
Why it may be useful
This indicator provides traders with a reliable, non-repainting method to confirm trend direction without relying on complex oscillators or lagging indicators. Its visual histogram makes it easy to quickly interpret market sentiment, allowing traders to make more informed decisions about potential entry and exit points.
By analyzing the relationship between daily and 4-hour open prices, the indicator offers insights into underlying market dynamics that might not be immediately apparent through traditional price action analysis. The non-repainting feature ensures that historical data remains consistent, making it a trustworthy tool for both real-time trading and backtesting strategies.
When to explore it
The Custom AO with Open Difference Indicator is most effective in markets with clear, developing trends where open price variations can signal potential momentum shifts. It works particularly well in timeframes ranging from intraday to short-term trading, where quick identification of trend changes can be crucial for making timely trading decisions.
Traders should consider using this indicator during periods of market volatility, when traditional trend indicators might provide less clear signals. It is especially useful for traders who prefer a straightforward, visually intuitive approach to trend confirmation and momentum analysis.
Keep exploring
What we’ve verified
Access, alerts and repainting behaviour have not been independently verified for this indicator. Check the creator’s current publication and settings.
General descriptions and classifications are recovered research. Verified details above identify the specific checks we have completed. Check the creator’s current publication for later changes.