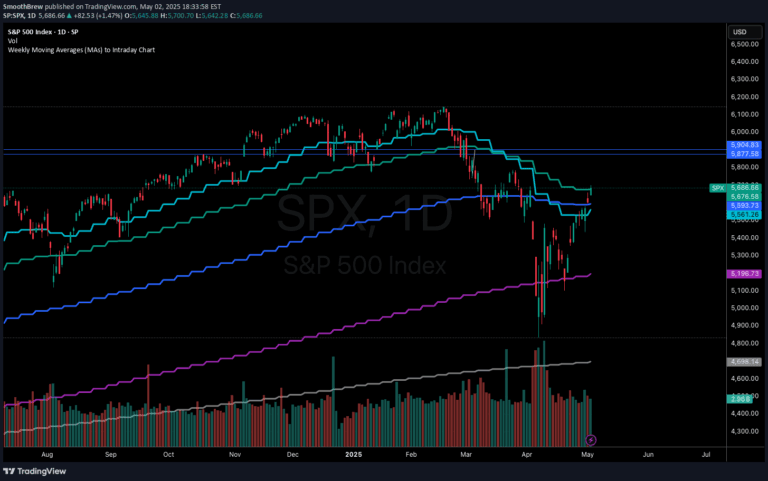
A trading indicator that plots key daily moving averages as horizontal lines on intraday charts, helping traders identify potential support and resistance levels across different timeframes.
Explore complementary indicator rolesHow it works
The indicator calculates and plots daily moving averages including 5-day EMA, 10-day EMA, 21-day EMA, 50-day SMA, 100-day SMA, and 200-day SMA as horizontal lines directly on intraday charts. These lines represent the average price levels over specific time periods, with exponential moving averages (EMAs) giving more weight to recent prices and simple moving averages (SMAs) treating all prices equally.
By overlaying these moving average lines onto different intraday timeframes like 1-minute, 5-minute, 15-minute, and 30-minute charts, traders can visually track how current price action relates to longer-term trend indicators. Users can customize the indicator by toggling specific moving averages on or off and selecting different colors for each line.
Why it may be useful
Daily moving averages serve as critical reference points for understanding market trends, potential support and resistance levels, and price momentum across different timeframes. These lines help traders quickly identify whether an asset is in an uptrend, downtrend, or consolidation phase by showing how current prices interact with longer-term average price levels.
By providing a visual representation of key price levels, this indicator helps traders make more informed decisions about potential entry and exit points. It allows for multi-chart analysis, enabling traders to maintain a consistent view of an asset's trend across various intraday and daily chart configurations.
When to explore it
This indicator works best during trending market conditions where prices are consistently moving above or below key moving average levels. Traders can use it to identify potential trend reversals, support and resistance zones, and to confirm the strength of current price movements across different timeframes.
The indicator is particularly useful for traders employing multi-timeframe analysis, swing traders looking for longer-term trend confirmation, and day traders seeking precise entry and exit points. It can be especially valuable when trading major indexes, ETFs, and individual stocks where moving averages often act as significant psychological price levels.
Keep exploring
What we’ve verified
Access, alerts and repainting behaviour have not been independently verified for this indicator. Check the creator’s current publication and settings.
General descriptions and classifications are recovered research. Verified details above identify the specific checks we have completed. Check the creator’s current publication for later changes.