A comprehensive moving average indicator that visualizes market cycles and trend dynamics through customizable moving averages and color-coded time bands.
Explore complementary indicator rolesHow it works
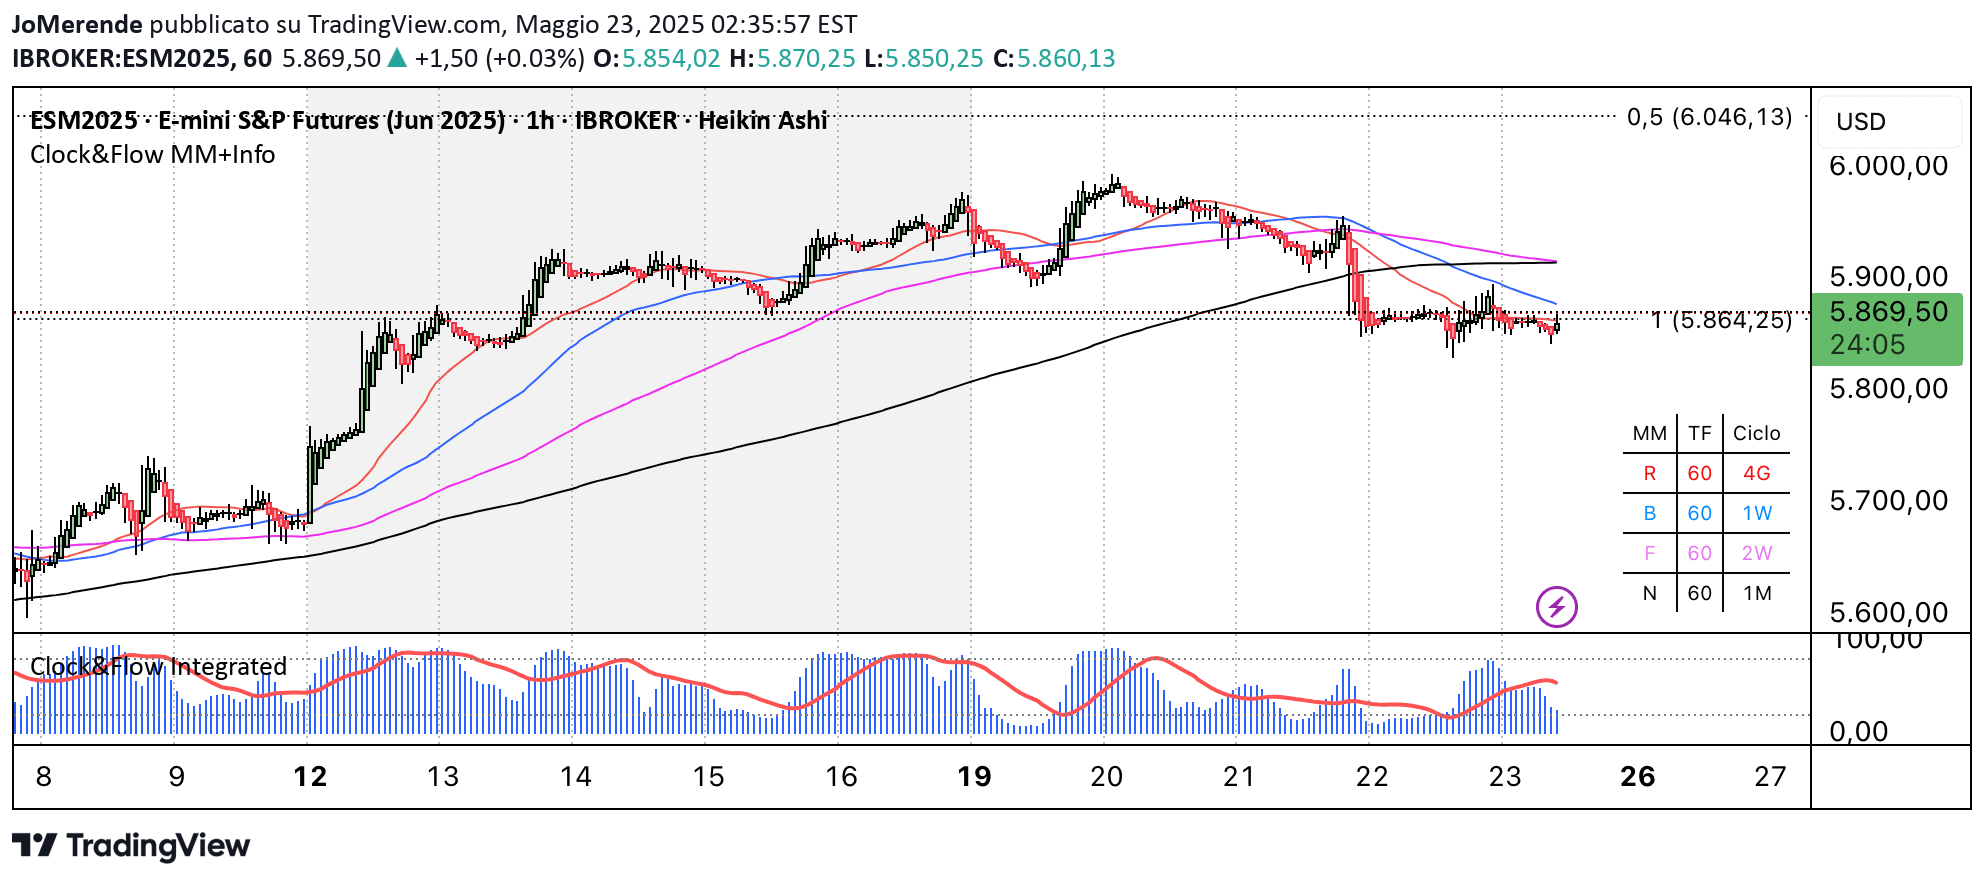
The indicator displays multiple moving averages with different periods based on cyclical durations, allowing traders to customize their view of market trends. It adapts to different trading hours and timeframes, providing flexible visualization of price movements across various instruments.
By adding colored background bands that change weekly or daily, the indicator helps traders quickly understand market cycles and time-based patterns. The accompanying information table shows which cycle the moving averages represent, making it easier to interpret the visual data and align trading strategies with market rhythms.
Why it may be useful
Moving averages are crucial tools for understanding market trends, and this indicator enhances their utility by offering a comprehensive, customizable view of price dynamics. Traders can quickly identify trend directions, potential support and resistance levels, and market cycles through intuitive visual representations.
The ability to adapt to different trading hours and timeframes makes this indicator versatile for various trading styles and instruments. By providing both moving average groups and time-based color bands, it offers traders a multi-dimensional perspective on market movements that can improve decision-making and strategic planning.
When to explore it
This indicator is most effective when traders want a comprehensive overview of market trends across different timeframes and trading sessions. It works particularly well for analyzing instruments with varying trading hours, such as futures contracts, where understanding cyclical patterns is crucial.
Traders can leverage this tool during periods of market transition, when identifying trend strength and potential cycle changes is important. It is especially useful for technical analysts who rely on moving averages and time-based analysis to make informed trading decisions across different market conditions.
Keep exploring
What we’ve verified
Access, alerts and repainting behaviour have not been independently verified for this indicator. Check the creator’s current publication and settings.
General descriptions and classifications are recovered research. Verified details above identify the specific checks we have completed. Check the creator’s current publication for later changes.