
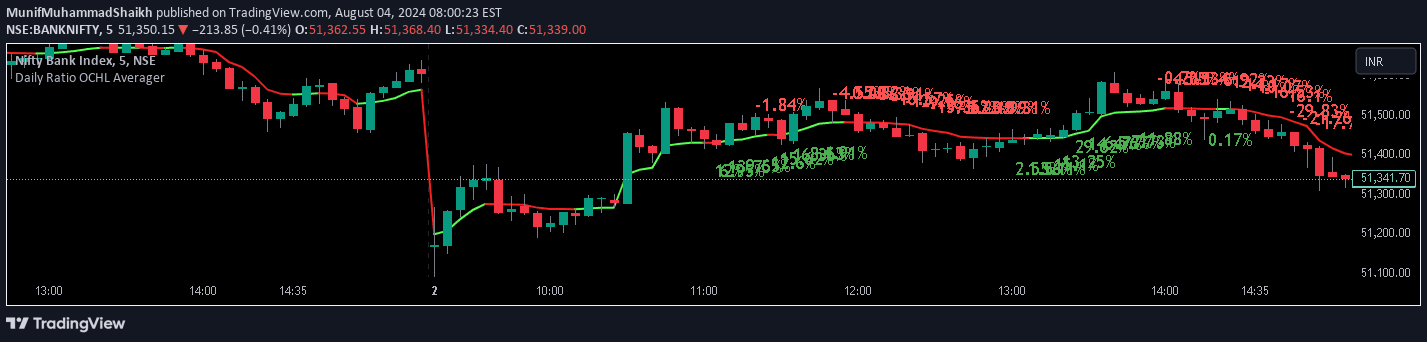
A daily price average indicator that calculates a normalized ratio between open, close, high, and low prices to help traders analyze price behavior and potential market conditions.
Explore complementary indicator rolesHow it works
The Daily Ratio OCHL Averager calculates an average value by processing daily open, close, high, and low prices through a normalized ratio calculation. This process transforms raw price data into a percentage-based metric that represents the relationship between current prices and their historical values.
By computing this ratio, the indicator generates a dynamic average line that can be plotted directly on the price chart. The line's color changes based on whether the current price is above (green) or below (red) the calculated average, providing immediate visual feedback about price positioning.
Why it may be useful
This indicator offers traders a quick and intuitive method for understanding price dynamics by converting complex price relationships into a simple, color-coded visualization. The normalized ratio provides a standardized way to compare price performance across different financial instruments and market conditions.
By transforming raw price data into an easily interpretable format, the Daily Ratio OCHL Averager helps traders rapidly assess market sentiment, identify potential trend shifts, and make more informed trading decisions with enhanced visual clarity.
When to explore it
The Daily Ratio OCHL Averager is most effective in markets with clear directional movements and consistent price patterns. It performs exceptionally well in liquid markets like forex, major stock indices, and high-volume commodities where price data is reliable and frequent.
Traders should use this indicator during active trading sessions, particularly when seeking to understand short-term price momentum and potential trend reversals. It is particularly useful for scalpers and day traders who need rapid, visual insights into market behavior and price positioning.
Keep exploring
What we’ve verified
Access, alerts and repainting behaviour have not been independently verified for this indicator. Check the creator’s current publication and settings.
General descriptions and classifications are recovered research. Verified details above identify the specific checks we have completed. Check the creator’s current publication for later changes.


