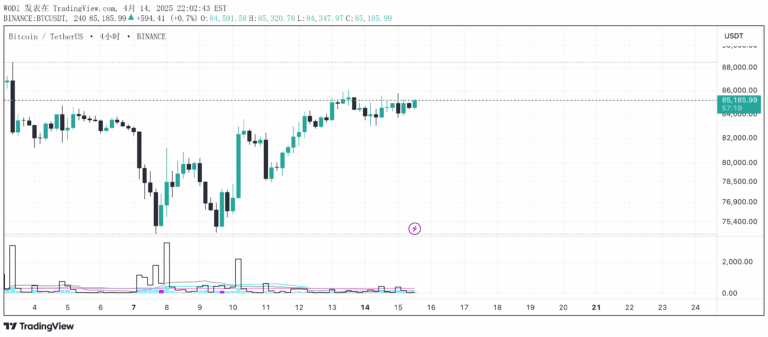
A dynamic indicator comparing volume percentage change with ATR percentage change to assess market momentum and volume efficiency across different trading timeframes.
Explore complementary indicator rolesHow it works
The Delta Volume-ATR Change Indicator calculates percentage changes in volume and Average True Range (ATR) between two consecutive bars. It computes the volume change by comparing current and previous volume levels, while simultaneously measuring ATR percentage change to understand price volatility.
The indicator then subtracts the ATR percentage change from the volume percentage change, creating a 'Delta' value that represents the relationship between volume and price movement. Positive delta values suggest strong volume driving price action, while negative delta values indicate weaker volume support relative to price volatility.
Why it may be useful
Traders need accurate insights into market momentum, and this indicator provides a nuanced view of how volume interacts with price volatility. By quantifying the efficiency of volume in driving price movements, traders can make more informed decisions about market strength and potential trend continuations or reversals.
The visual representation through color-coded bars and multiple display styles allows traders to quickly interpret volume dynamics. This helps in understanding whether current market conditions support sustained price movement or if there might be underlying weakness in the trading volume.
When to explore it
The Delta Volume-ATR Change Indicator is most effective in markets with moderate to high trading activity, where volume changes can significantly impact price movements. It works particularly well in liquid markets like forex, stocks, and futures, where volume data provides meaningful insights into market sentiment.
Traders should use this indicator during periods of potential trend changes, breakouts, or when assessing the reliability of a current price movement. It is especially useful for short-term and swing traders who need to quickly evaluate the strength of market momentum based on volume efficiency.
Keep exploring
What we’ve verified
Access, alerts and repainting behaviour have not been independently verified for this indicator. Check the creator’s current publication and settings.
General descriptions and classifications are recovered research. Verified details above identify the specific checks we have completed. Check the creator’s current publication for later changes.