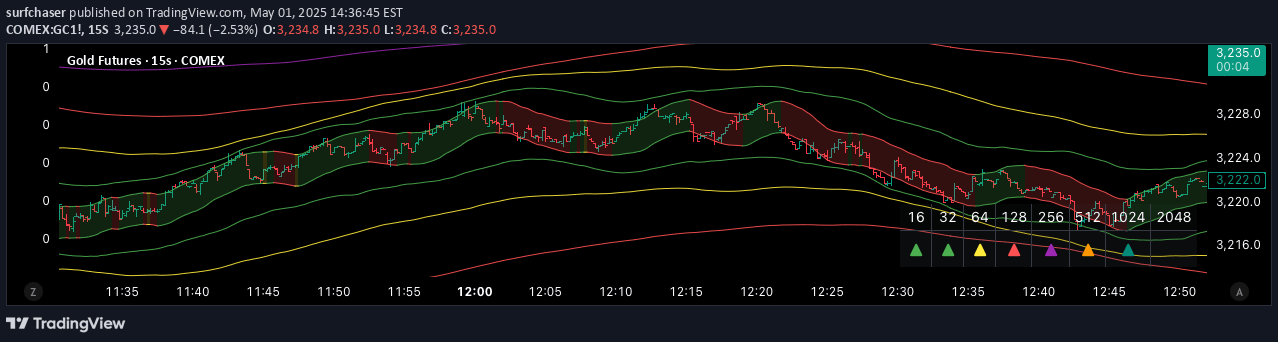
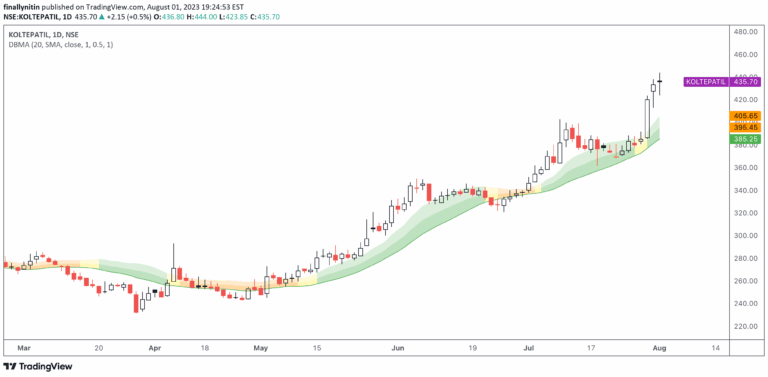
A flexible moving average indicator with multiple MA types and customizable percentage-based displacement bands, offering dynamic insights into price action and market volatility.
Explore complementary indicator rolesHow it works
The indicator calculates a primary moving average using selectable types like WMA, EMA, SMA, HMA, and VWAP, with customizable lookback periods across different timeframes. It generates percentage-based displacement bands around the main moving average, allowing traders to visualize price deviations from the average with configurable percentage levels from 2% to 70%.
Additionally, the indicator includes three supplementary moving averages with standard deviation bands, providing multi-timeframe volatility analysis. Traders can adjust sigma multipliers, MA lengths, and toggle band visibility, creating a comprehensive tool for analyzing price movement and market dynamics.
Why it may be useful
This indicator offers unprecedented flexibility in analyzing market trends and volatility, allowing traders to customize their technical analysis approach to suit specific market conditions and trading strategies. By providing multiple moving average types and displacement bands, it helps traders identify potential support and resistance levels, detect overbought or oversold conditions, and understand price movement dynamics.
The multi-timeframe standard deviation bands provide additional context about market volatility, enabling traders to make more informed decisions. The ability to fine-tune settings like smoothing types, lookback periods, and band visibility makes this indicator a powerful tool for comprehensive market analysis across different trading styles and timeframes.
When to explore it
The indicator is most effective in markets with clear trending characteristics, where price tends to respect moving averages and show consistent directional movement. It works particularly well in liquid markets like forex, stocks, and cryptocurrencies, where price tends to respect technical levels and show predictable volatility patterns.
Traders should use this indicator during periods of stable market conditions, avoiding its use during extreme news events or high-impact economic announcements that can cause unpredictable price swings. It is especially useful for traders seeking a customizable, adaptable tool that can be tailored to different market environments and personal trading preferences.
Keep exploring
What we’ve verified
Access, alerts and repainting behaviour have not been independently verified for this indicator. Check the creator’s current publication and settings.
General descriptions and classifications are recovered research. Verified details above identify the specific checks we have completed. Check the creator’s current publication for later changes.