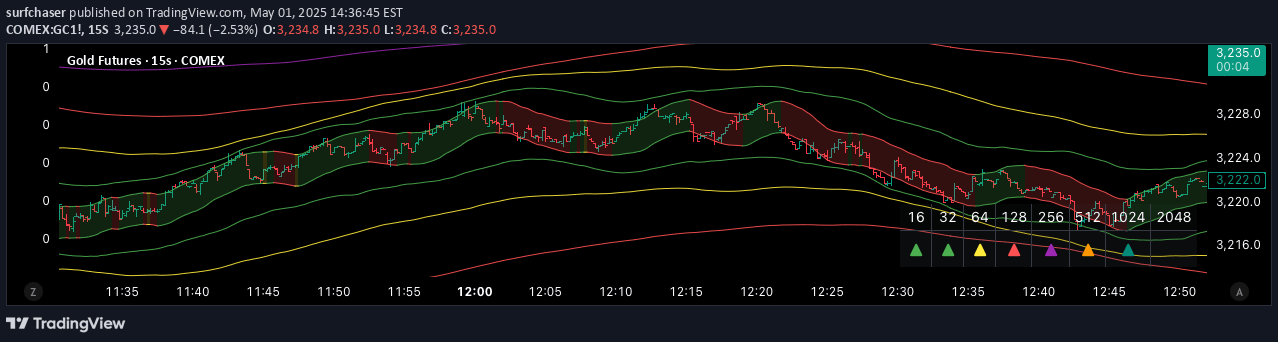
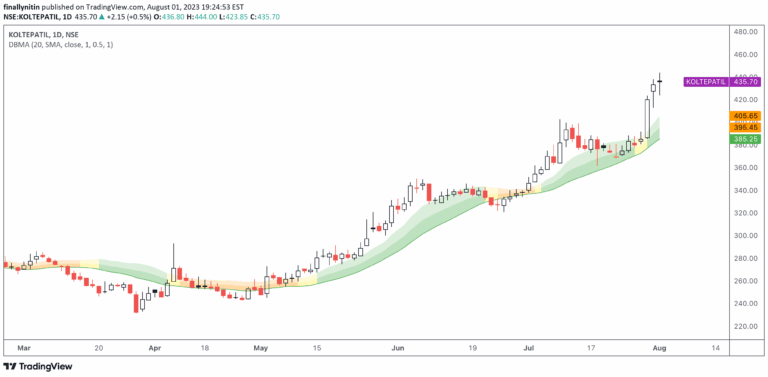
Double Bollinger Bands strategy uses two sets of bands with different standard deviations to identify potential trend reversals and trading opportunities in trending markets.
Explore complementary indicator rolesHow it works
The Double Bollinger Bands strategy employs two sets of Bollinger Bands with different standard deviations: one with 2 standard deviations and another with 3 standard deviations. Both sets use a 20-bar simple moving average (SMA) as the centerline. The bands expand and contract based on price volatility, creating dynamic support and resistance levels.
To generate trading signals, the strategy looks for specific price interactions with these bands. A buy signal occurs when price falls below the lower 3-standard deviation band and then rises above the lower 2-standard deviation band. Conversely, a sell signal happens when price rises above the upper 3-standard deviation band and then falls below the upper 2-standard deviation band.
Why it may be useful
The Double Bollinger Bands strategy provides traders with a systematic approach to identifying potential trend reversals and entry points. By using multiple standard deviation bands, the indicator offers a more nuanced view of price volatility compared to traditional single-band indicators.
This approach helps traders distinguish between minor price fluctuations and significant trend changes. The strategy's visual triangular markers make it easier for traders to quickly identify potential trade opportunities. By combining trend-following principles with volatility analysis, the indicator helps traders make more informed decisions about market entry and exit points.
When to explore it
The Double Bollinger Bands strategy works best in trending markets with clear directional movements. It is particularly effective in markets that exhibit consistent volatility and have identifiable trend patterns. Traders should consider using this strategy in markets with moderate to high liquidity, such as major currency pairs, stock indices, and actively traded commodities.
The indicator is less reliable in choppy, range-bound markets where price movements are erratic and lack clear direction. Traders should combine this strategy with other technical analysis tools and confirm signals with additional indicators to improve the probability of successful trades.
Keep exploring
What we’ve verified
Access, alerts and repainting behaviour have not been independently verified for this indicator. Check the creator’s current publication and settings.
General descriptions and classifications are recovered research. Verified details above identify the specific checks we have completed. Check the creator’s current publication for later changes.