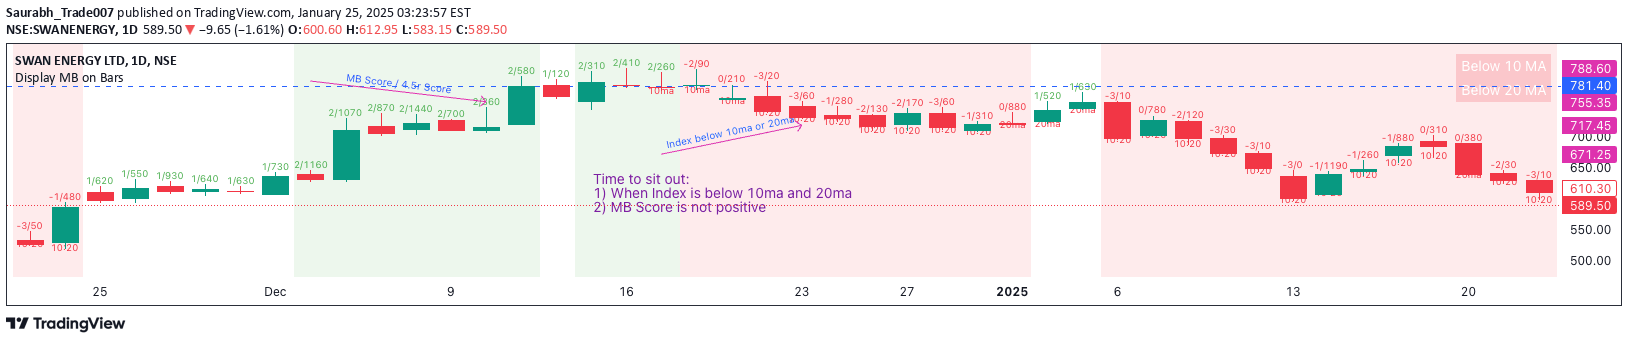
A Pine Script indicator that visualizes Market Breadth values and R4.5 scores, highlighting key market behavior through color-coded bars and moving average comparisons.
Explore complementary indicator rolesHow it works
The indicator operates by analyzing Market Breadth (MB) and R4.5 scores for specific dates, using predefined thresholds to color-code price bars. When MB values fall below the lower threshold, bars turn red, indicating potential negative market conditions. Conversely, bars turn green when MB exceeds the upper threshold, signaling potentially positive market behavior.
The script also calculates 10-day and 20-day moving averages for a selected symbol, creating a status table that shows the price's position relative to these key moving averages. Labels are dynamically generated on the chart when specific conditions are met, such as R4.5 scores exceeding 200 or particular MB thresholds.
Why it may be useful
Traders benefit from this indicator's ability to quickly visualize complex market metrics through intuitive color-coding and dynamic labeling. By transforming numerical data into visual cues, the script allows traders to rapidly assess market conditions without extensive manual calculation or analysis.
The moving average comparison table provides additional context, helping traders understand the current price momentum and positioning relative to short-term trend indicators. This multifaceted approach enables traders to make more informed decisions by combining multiple market insights into a single, easy-to-interpret visual representation.
When to explore it
This indicator is most effective for traders seeking comprehensive market insights across different trading timeframes, particularly in markets with complex breadth and momentum characteristics. It works best when traders want to quickly assess market conditions using custom metrics like MB and R4.5 scores, combined with moving average analysis.
The tool is particularly valuable during periods of market transition or when traders need to quickly identify potential trend shifts or momentum changes. By providing both quantitative data and visual indicators, it supports decision-making in day trading and swing trading scenarios where understanding broader market dynamics is crucial.
Keep exploring
What we’ve verified
Access, alerts and repainting behaviour have not been independently verified for this indicator. Check the creator’s current publication and settings.
General descriptions and classifications are recovered research. Verified details above identify the specific checks we have completed. Check the creator’s current publication for later changes.