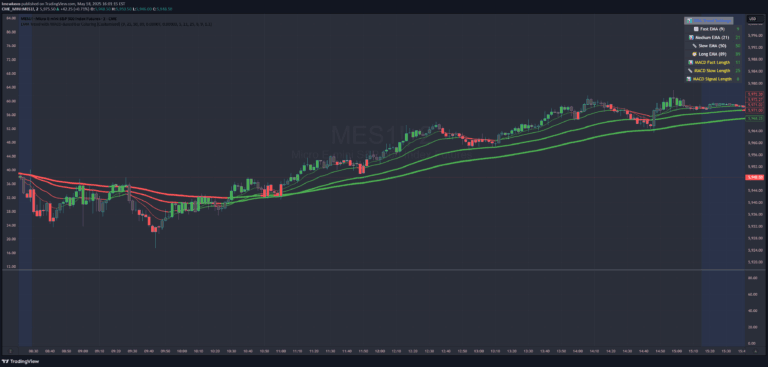
A custom candle coloring indicator that reveals market control by analyzing bull and bear pressure through EMA-based calculations, providing visual sentiment insights for traders.
Explore complementary indicator rolesHow it works
The BvB Dominance Bars indicator calculates market control by comparing price to a short-term exponential moving average (EMA). It measures bull pressure by how far the high is above the EMA and bear pressure by how far the low is below the EMA. These measurements are then normalized over a lookback period to create percentile scores between 0 and 100 for both bulls and bears.
The indicator then color-codes candles based on these normalized scores, creating a visual representation of market sentiment. Bright lime indicates strong bull dominance, soft lime/yellow shows moderate bull control, bright red represents strong bear dominance, and soft red/yellow indicates moderate bear control. Gray candles signify neutral or low-conviction market conditions.
Why it may be useful
Traders need clear visual cues to understand market sentiment quickly, and this indicator provides an intuitive way to see who's controlling price movement. By normalizing bull and bear pressure, it offers a more nuanced view of market dynamics than traditional indicators, helping traders identify potential trend shifts and momentum changes.
The color-coded approach allows traders to instantly recognize market conditions without complex calculations. It transforms abstract market data into an easy-to-understand visual format, enabling faster decision-making and reducing the cognitive load of interpreting multiple technical indicators simultaneously.
When to explore it
The BvB Dominance Bars indicator works best when used as a confirmation tool alongside existing trading strategies. It is particularly effective for traders looking to validate their market bias or identify potential trend reversals at key support and resistance levels. The indicator is most valuable for intraday traders who need quick insights into market momentum and sentiment shifts.
Traders should avoid using this indicator as a standalone signal and instead integrate it with other technical analysis tools. It is most powerful when combined with price action strategies, trend-following methods, or supply and demand zone analysis. The indicator is especially useful during ranging or transitional market conditions where clear trend direction is not immediately apparent.
Keep exploring
What we’ve verified
Access, alerts and repainting behaviour have not been independently verified for this indicator. Check the creator’s current publication and settings.
General descriptions and classifications are recovered research. Verified details above identify the specific checks we have completed. Check the creator’s current publication for later changes.