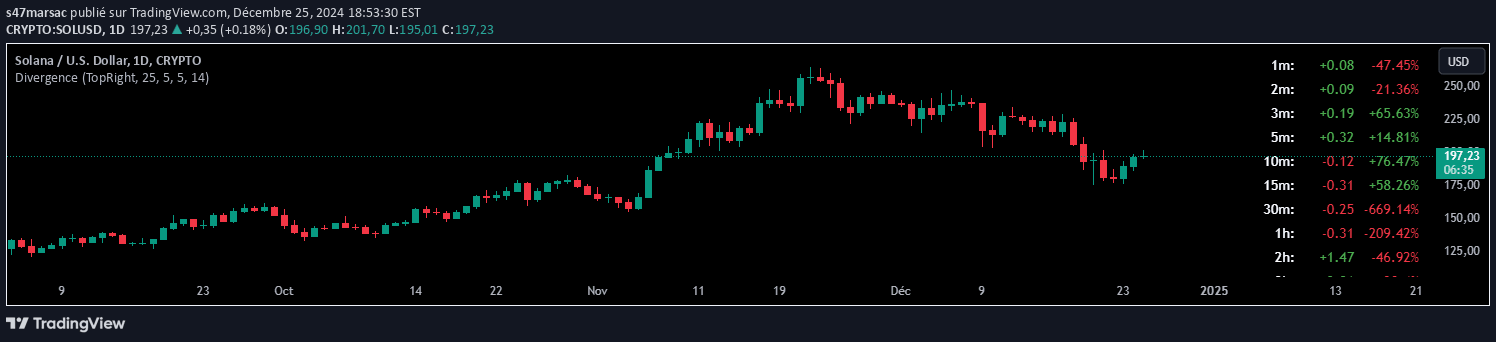
A sophisticated trading indicator that analyzes divergence patterns between financial instruments, providing insights into market trends and potential trading opportunities through advanced comparative analysis.
Explore complementary indicator rolesHow it works
The Divergence Analyzer compares two financial instruments using logarithmic scale calculations and linear regression techniques. It generates a divergence delta plot by normalizing standard deviations and applying smoothed exponential moving averages to identify potential market trend shifts.
The indicator calculates linear regression coefficients on a logarithmic scale, enabling precise comparison of price movements between selected symbols. By utilizing dynamic length parameters and advanced smoothing techniques, the tool provides a comprehensive view of trend strength and potential divergence patterns.
Why it may be useful
The Divergence Analyzer offers traders a powerful tool to understand complex market relationships and potential trend reversals across different financial instruments. By providing normalized volatility comparisons and color-coded visualizations, traders can quickly identify significant market divergences that might indicate upcoming price movements.
This sophisticated analysis helps traders make more informed decisions by revealing hidden relationships between symbols that might not be immediately apparent through traditional analysis methods. The indicator's flexibility in symbol selection and customizable parameters allows traders to adapt their strategy to various market conditions and trading styles.
When to explore it
The Divergence Analyzer is most effective when analyzing correlated or interrelated financial instruments with potential systemic relationships. Traders can leverage this tool during periods of market uncertainty or when seeking to identify potential trend reversals across different market segments.
The indicator becomes particularly valuable during volatile market conditions, when traditional analysis methods might provide incomplete insights. Traders can use this tool across multiple timeframes, from scalping to swing trading, to gain a comprehensive understanding of potential market movements and underlying trend dynamics.
Keep exploring
What we’ve verified
Access, alerts and repainting behaviour have not been independently verified for this indicator. Check the creator’s current publication and settings.
General descriptions and classifications are recovered research. Verified details above identify the specific checks we have completed. Check the creator’s current publication for later changes.