YOUR INDICATOR RESEARCH STARTS HERE

Find the right indicator.
Understand what it does.

Explore 11,183 indicators. Filter beyond the obvious.
Discover the tools that fit the way you trade.

THE INDICATOR LIBRARY

Results for “comparison”

11,183 tools to explore

325 indicators matching your filters
Save search
VolumeTrend

Global Liquidity Index

by QuantitativeAlpha

Global Liquidity Index tracks worldwide central bank balance sheets, providing a comprehensive view of global monetary conditions and potential market trends through consolidated financial data.

Separate pane · unverifiedSwing Trading
Explore
7.5Klikes212.7Kviews110comments
Save
VolumeTrendSignal

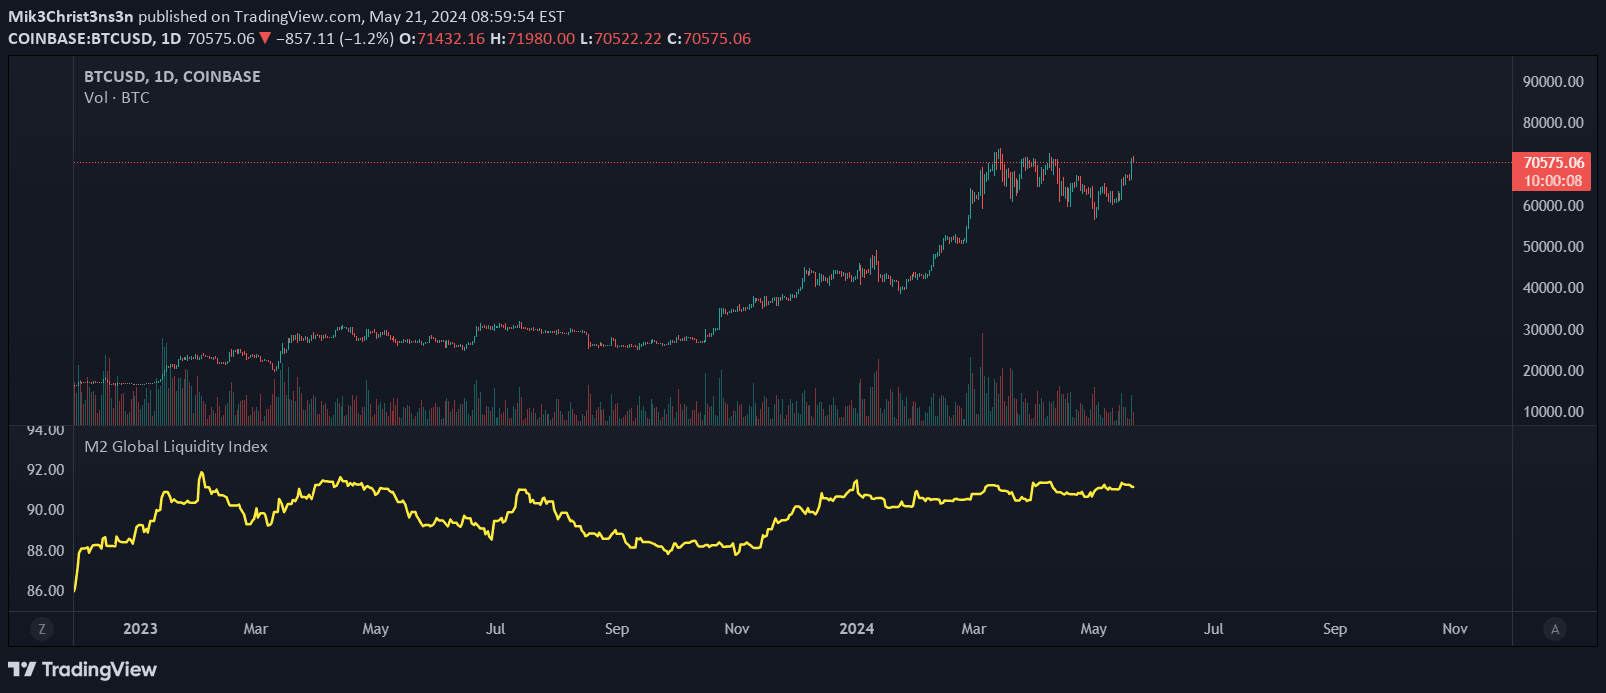
M2 Global Liquidity Index

by Mik3Christ3ns3n

The M2 Global Liquidity Index tracks aggregate money supply across five major currencies, providing a comprehensive view of global economic liquidity and potential market trends.

Separate pane · unverifiedSwing Trading
Explore
2.8Klikes72.7Kviews0comments
Save
OscillatorSignalTrend

Currency Strength [LuxAlgo]

by LuxAlgo

A currency strength indicator that measures relative performance of currencies by comparing their exchange rates and tracking their strength over time using a specialized meter and scatter plot.

Separate pane · unverifiedScalping · Day Trading
Explore
2.2Klikes53.5Kviews15comments
Save
PatternsSignalTrend

Price Action Color Forecast (Expo)

by Zeiierman

A trading tool that predicts market movements by analyzing historical candlestick colors and patterns, projecting future price action based on similar past events.

Main price chart · unverifiedScalping · Day Trading
Explore
2.1Klikes75.9Kviews31comments
Save
SignalTrend

Trendilo (OPEN-SOURCE)

by dudeowns

Trendilo is a custom TradingView indicator that identifies market trends by analyzing percentage change and using Arnaud Legoux Moving Average with RMS band comparison.

Main price chart · unverifiedScalping · Day Trading
Explore
1.8Klikes43.5Kviews37comments
Save
MomentumOscillatorVolume

Asset Rotation Aperture

by ColeGarner

Asset Rotation Aperture tracks volume accumulation across multiple assets, visualizing capital rotation and market narratives through normalized cumulative volume lines.

Separate pane · unverifiedScalping · Day Trading
Explore
1.5Klikes19.1Kviews30comments
Save
VolumeSignal

RVol Label

by ripster47

Relative Volume indicator measures trading volume compared to historical averages, helping traders identify significant market activity and potential trading opportunities across different timeframes.

Separate pane · unverifiedScalping · Day Trading
Explore
1.3Klikes15.7Kviews7comments
Save

Likes, views, and comments are historical TradingView snapshots. They describe attention, not trading performance.

START WITH A QUESTION

A little less searching.
A lot more understanding.

Tell DeepAlpha what you need. Get an explanation, a shortlist,
and a direct path to the indicators behind it.

Ask DeepAlpha