Heatmap Volume [xdecow]
A volume heat map indicator that colors volume bars and candles based on the standard deviation of trading volume from its average. Provides visual insights into volume intensity and potential market significance.
Explore 11,183 indicators. Filter beyond the obvious.
Discover the tools that fit the way you trade.
11,183 tools to explore
A volume heat map indicator that colors volume bars and candles based on the standard deviation of trading volume from its average. Provides visual insights into volume intensity and potential market significance.
Volume Footprint Voids is a trading indicator that uses lower timeframe calculations to plot single candle Point of Control (POC) and identify volume imbalances for precise entry and exit points.
Volume Order Blocks is a powerful trading indicator that identifies significant order blocks using EMA crossovers, volume analysis, and price structure to highlight key supply and demand zones.
A dynamic trend indicator that fits regression lines at different intervals, revealing market trends and potential price channels by calculating linear trends across specified timeframes.
A liquidity analysis tool that identifies key price levels with significant trading volume, helping traders understand market depth and potential support/resistance zones.
An advanced volume indicator that visualizes buy and sell volume distribution within each candlestick, offering detailed insights into market sentiment and order flow dynamics.
A data visualization tool that helps traders analyze the distribution of numerical data by dividing it into bins and calculating the percentage of data points in each range.
A trading script that detects range-bound market conditions and breakout signals by analyzing volatility compression and volume imbalance across different market timeframes.
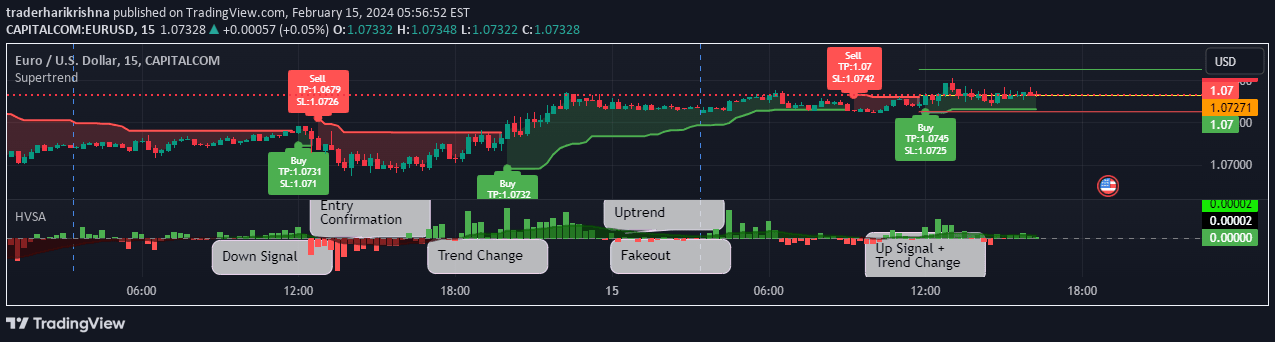
Volume Spread Analysis indicator that detects market divergences and convergences by analyzing the relationship between price movements and trading volume.
A comprehensive toolkit analyzing net buying and selling flows to reveal market dynamics, providing traders with insights into money movement and potential trend changes across different display modes.
A Volume Spread Analysis indicator that identifies trend direction and volume breakouts by analyzing price, volume changes, and histogram crossovers for potential trading signals.
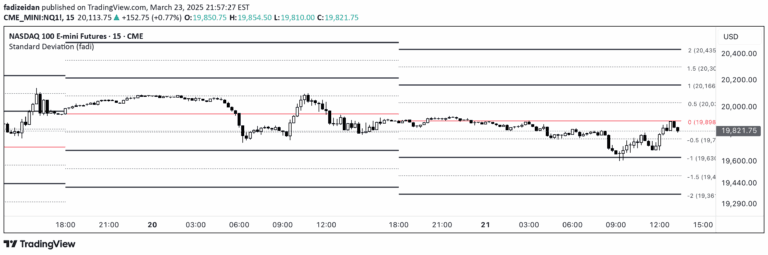
Standard Deviation indicator maps price movements by measuring how far prices deviate from their average, revealing market volatility and potential trend reversals using statistical analysis.
Likes, views, and comments are historical TradingView snapshots. They describe attention, not trading performance.