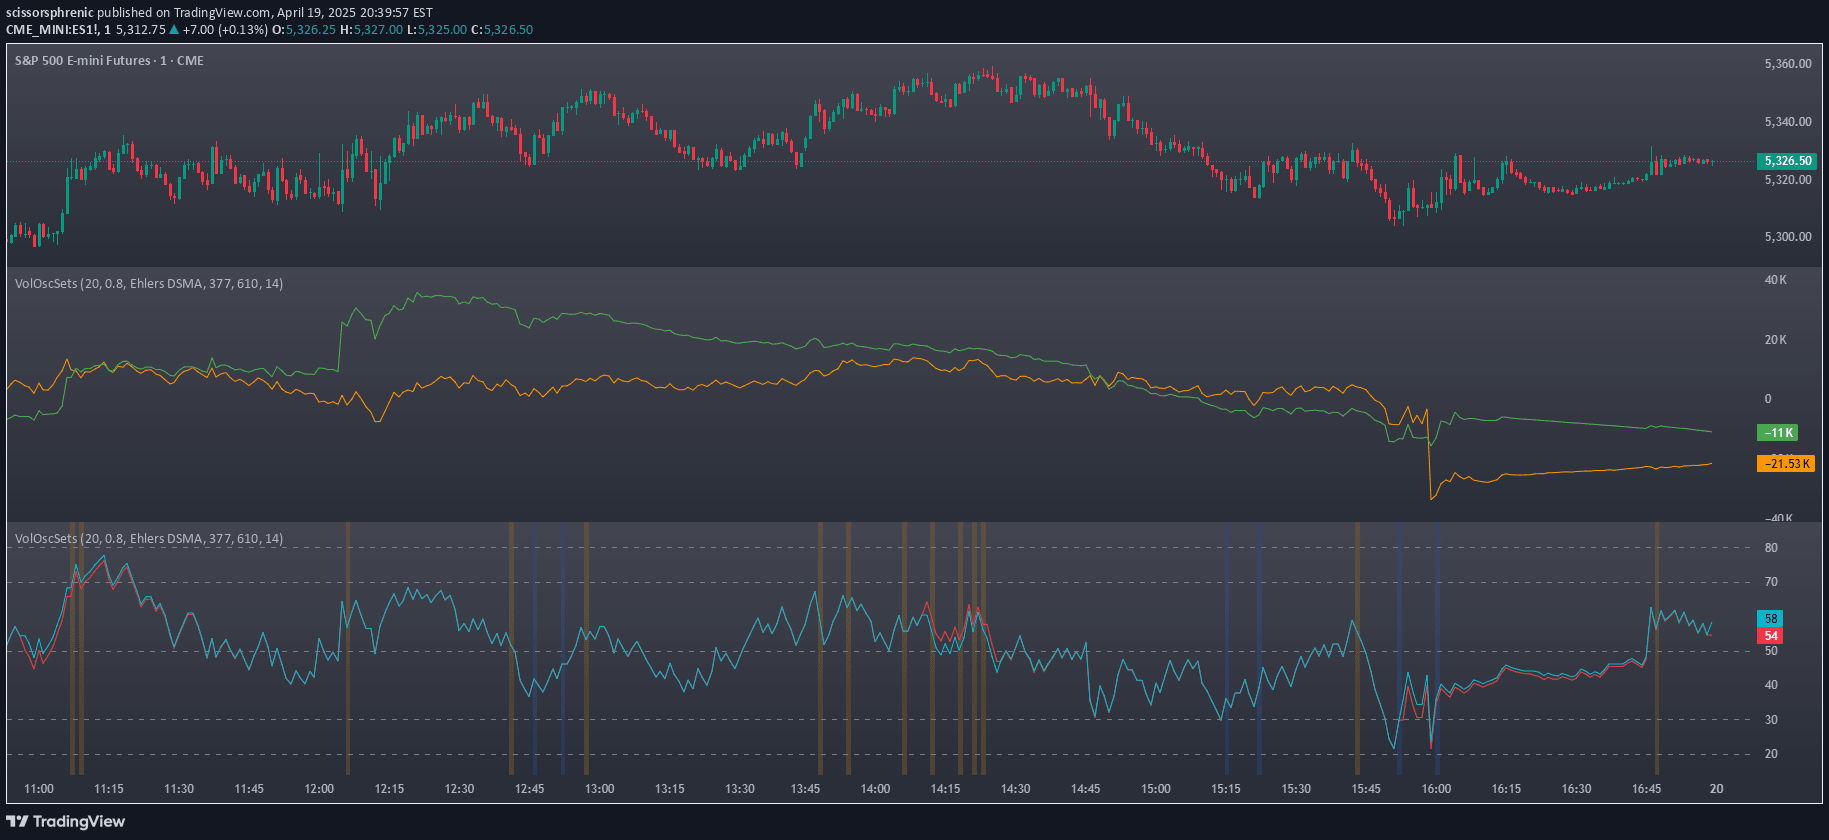
A comprehensive toolkit analyzing net buying and selling flows to reveal market dynamics, providing traders with insights into money movement and potential trend changes across different display modes.
Explore complementary indicator rolesHow it works
The Net Buying/Selling Flows Toolkit processes volume data on lower timeframes by distinguishing between buying and selling pressures through intra-bar price analysis. It identifies transactions where bars close higher or lower than their opening price, aggregating these movements to calculate net selling and buying volumes.
By analyzing these transactions, the toolkit generates visual representations of market flows using multiple display modes like Flow Comparison, Net Flow, and Sum of Flows. Traders can customize lookback periods, set deviation thresholds, and enable reversal signals to gain deeper insights into market dynamics and potential trading opportunities.
Why it may be useful
The toolkit provides traders with a sophisticated method of understanding market sentiment beyond traditional price action analysis. By breaking down volume data into buying and selling pressures, it offers a more nuanced view of market fundamentals, helping traders identify potential trend reversals and momentum shifts before significant price movements.
Unlike typical trend-following indicators, this toolkit's unique 'Sum of Flows' mode can act as a leading indicator, revealing bullish or bearish net flows potentially before price changes occur. This approach gives traders a strategic advantage in anticipating market movements and making more informed trading decisions.
When to explore it
The Net Buying/Selling Flows Toolkit is most effective in markets with clear volume data and significant institutional or algorithmic trading activity. It works exceptionally well for traders seeking to understand underlying market dynamics across various timeframes, from scalping to swing trading.
Traders should utilize this toolkit during periods of market uncertainty, when traditional price action might not provide clear signals. It is particularly useful in volatile markets, during economic announcements, or when analyzing assets with complex trading patterns that require deeper volume analysis.
Keep exploring
What we’ve verified
Access, alerts and repainting behaviour have not been independently verified for this indicator. Check the creator’s current publication and settings.
General descriptions and classifications are recovered research. Verified details above identify the specific checks we have completed. Check the creator’s current publication for later changes.