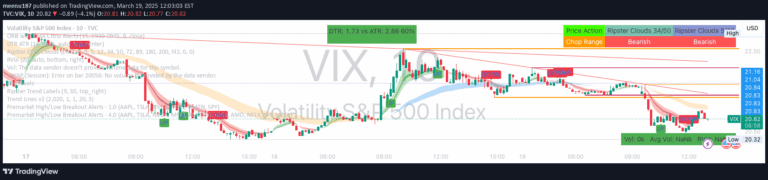
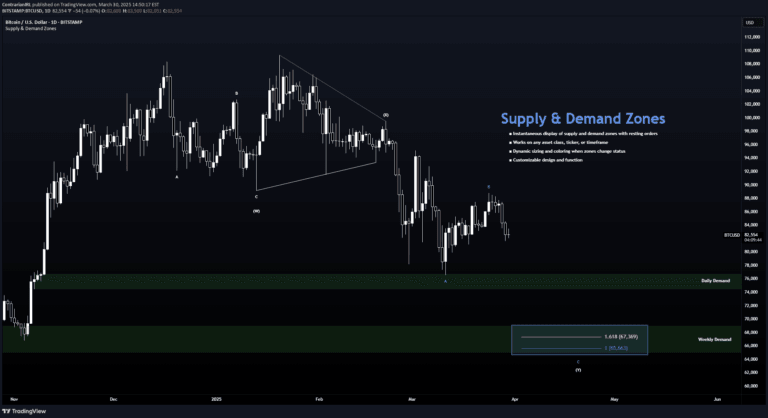
A Gann levels indicator that adds horizontal lines at the closest Gann level and four lines above and below, helping traders identify potential support and resistance zones.
Explore complementary indicator rolesHow it works
The Gann levels indicator uses the Squares of 9 method to generate horizontal lines on a price chart. It identifies the Gann level closest to the day's closing price and then adds four additional lines above and below this central level, creating a structured grid of potential support and resistance zones.
By calculating Gann levels from 1 to 10,000, the indicator provides a comprehensive framework for analyzing price movements. These levels are mathematically derived and help traders understand potential price symmetry and geometric relationships in market dynamics.
Why it may be useful
Gann levels offer traders a unique perspective on potential price movements by revealing geometric relationships and symmetry in market behavior. These levels can help identify key support and resistance zones that might not be apparent through traditional technical analysis methods.
By providing multiple reference levels around a central point, the indicator gives traders a more nuanced view of potential price interactions. This can help in making more informed decisions about entry, exit, and stop-loss placement.
When to explore it
The Gann levels indicator is most effective in markets with clear trending or ranging characteristics. It works particularly well in timeframes where geometric price patterns are more pronounced, such as intraday and short-term trading scenarios.
Traders should use this indicator in conjunction with other technical analysis tools to confirm signals and validate potential trade setups. It is especially useful for scalpers and day traders who need quick, precise insights into potential price movement zones.
Keep exploring
What we’ve verified
Access, alerts and repainting behaviour have not been independently verified for this indicator. Check the creator’s current publication and settings.
General descriptions and classifications are recovered research. Verified details above identify the specific checks we have completed. Check the creator’s current publication for later changes.