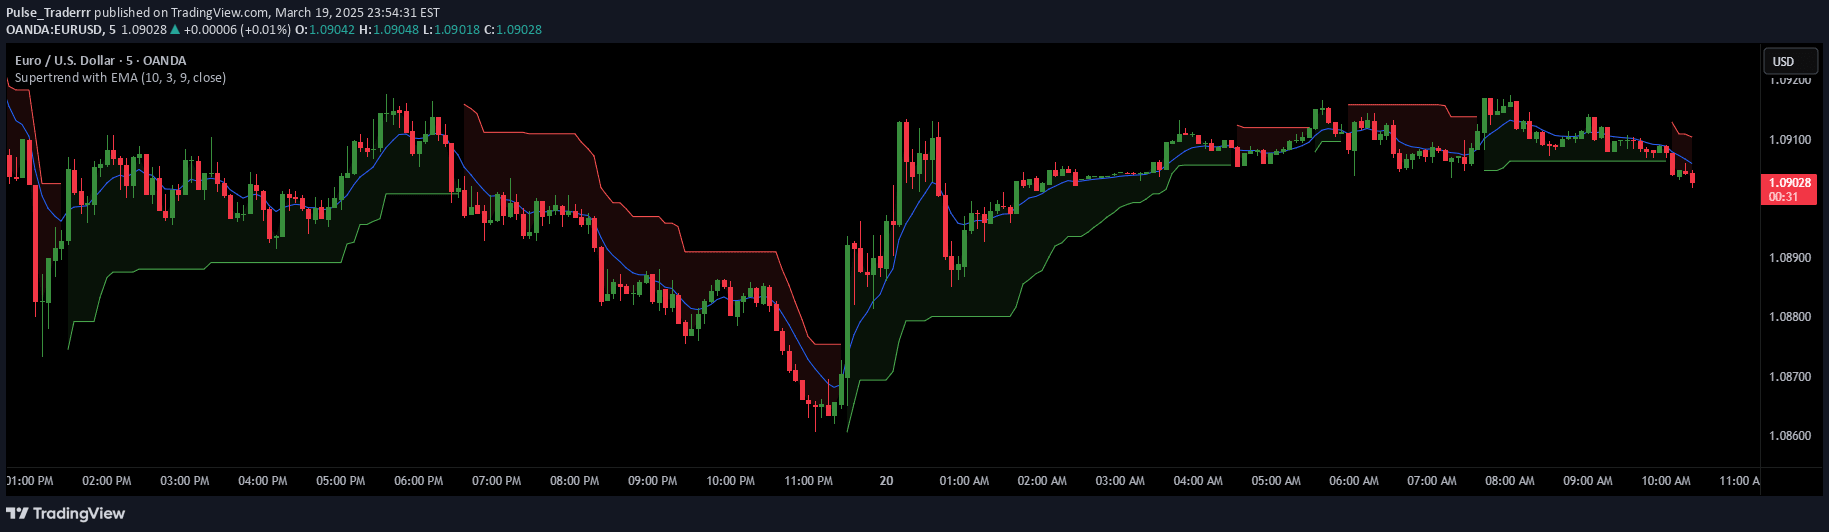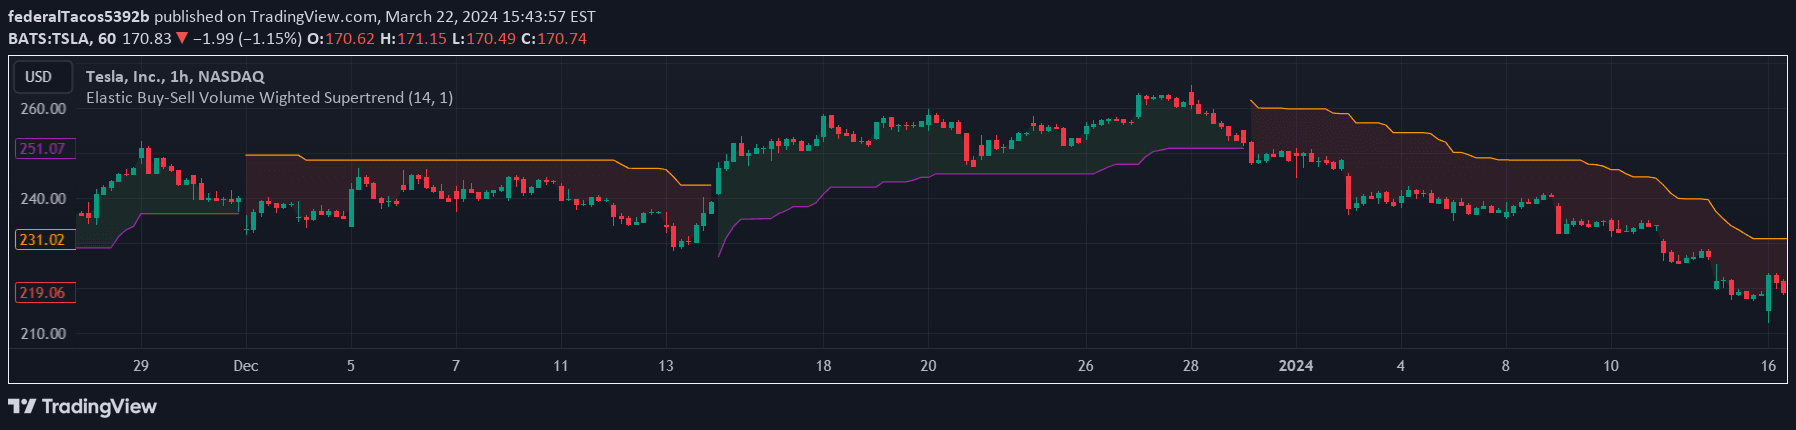
A dynamic supertrend indicator that adjusts multipliers using volume-weighted buy and sell ATR, providing adaptive trend and volatility insights across different market conditions.
Explore complementary indicator rolesHow it works
The indicator calculates buy and sell ATR using volume-weighted averages from lower timeframes, focusing on up and down volume dynamics. It derives a unique multiplier by comparing the asset's Average True Range to a broader market benchmark, integrating both historical volatility context and short-term fluctuations.
The dynamic multiplier adapts by analyzing two key components: the ratio of the asset's ATR to a market benchmark and the coefficient of variation of the True Range. This approach allows the indicator to dynamically adjust its trend bands, providing a more responsive and context-aware method of identifying market trends and potential signal levels.
Why it may be useful
Traditional supertrend indicators often require manual multiplier selection, which can limit their effectiveness across different stocks and timeframes. This enhanced version overcomes that limitation by automatically calibrating its sensitivity based on the specific asset's volatility characteristics, providing traders with a more nuanced and adaptive trend analysis tool.
By incorporating volume-weighted calculations and dynamically adjusting the multiplier, the indicator offers a more sophisticated approach to trend identification. It helps traders make more informed decisions by providing insights into both long-term volatility trends and short-term market fluctuations, potentially improving entry and exit timing.
When to explore it
The indicator is most effective in markets with varying volatility profiles, where traditional static indicators might produce less reliable signals. It performs exceptionally well in assets that experience significant volume-driven price movements, such as stocks with high institutional trading activity or during periods of market transition.
Traders should consider using this indicator during market conditions with changing volatility, such as around major economic announcements, earnings reports, or sector-wide shifts. Its adaptive nature makes it particularly useful for traders seeking a more responsive and context-aware trend analysis tool across different timeframes and market environments.
Keep exploring
What we’ve verified
Access, alerts and repainting behaviour have not been independently verified for this indicator. Check the creator’s current publication and settings.
General descriptions and classifications are recovered research. Verified details above identify the specific checks we have completed. Check the creator’s current publication for later changes.