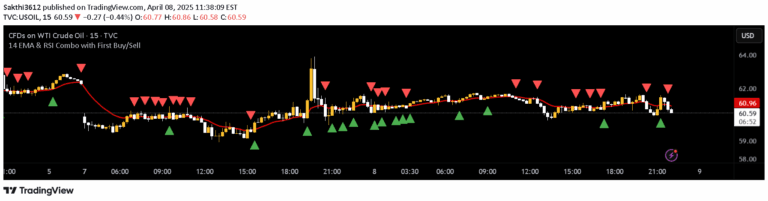
A comprehensive multi-indicator trading system combining EMA, VWAP, MACD, and RSI to provide clear trend, momentum, and overbought/oversold signals for traders.
Explore complementary indicator rolesHow it works
The multi-indicator system analyzes market trends and momentum through a combination of technical indicators. It starts with a Triple EMA system that tracks short-term and medium-term price movements, identifying trend direction by comparing the 9, 21, and 50-period exponential moving averages.
Additionally, the system incorporates VWAP to track intraday fair value, MACD to detect momentum shifts, and RSI to measure overbought and oversold conditions. These indicators work together to provide a comprehensive view of market dynamics, with color-coded signals for quick and easy interpretation.
Why it may be useful
This multi-indicator system provides traders with a holistic approach to market analysis, eliminating the need for multiple separate indicators cluttering the chart. By combining trend, momentum, and sentiment indicators, traders can make more informed decisions with a single, integrated tool.
The color-coded dashboard allows for rapid assessment of market conditions, helping traders quickly identify potential entry and exit points. Its flexibility across different timeframes and asset classes makes it a versatile tool for various trading styles and market environments.
When to explore it
The indicator is most effective in markets with clear trend characteristics, such as stocks, forex, and cryptocurrencies. It works best when used on timeframes ranging from 1-minute to daily charts, providing insights for scalpers, day traders, and swing traders alike.
Traders should pay special attention to confluence points where multiple indicators align, such as EMA trend confirmation, MACD momentum signals, and RSI extreme readings. It's particularly useful during trending market conditions and when looking to identify potential trend reversals or continuation patterns.
Keep exploring
What we’ve verified
Access, alerts and repainting behaviour have not been independently verified for this indicator. Check the creator’s current publication and settings.
General descriptions and classifications are recovered research. Verified details above identify the specific checks we have completed. Check the creator’s current publication for later changes.