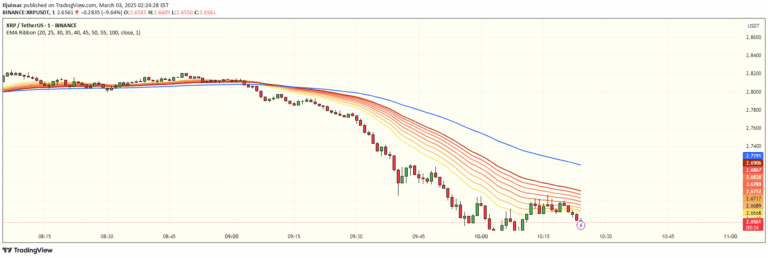
A custom moving average indicator that calculates multiple EMAs, displays MACD and RSI, and provides a color-coded trend table for quick market analysis.
Explore complementary indicator rolesHow it works
The indicator begins by calculating multiple Exponential Moving Averages (EMAs) using different input values for high, close, and low prices. It computes EMAs across various timeframes including 5, 50, 100, and 200 periods, creating a comprehensive view of price movement. The script uses the ta.ema() function to generate these moving averages, plotting them on the chart with distinct colors and line widths.
Additionally, the indicator calculates MACD and RSI to provide deeper insights into market momentum. It identifies potential long and short trading signals through EMA crossovers, marking these points with triangular indicators above or below price bars. The script also creates a color-coded trend table that offers traders an immediate visual representation of the current market trend.
Why it may be useful
This indicator provides traders with a multi-dimensional view of market trends by combining multiple technical analysis tools into a single, comprehensive script. By integrating different EMAs, MACD, and RSI, traders can gain a more nuanced understanding of price movement and potential trend changes.
The color-coded trend table allows for quick, intuitive market assessment, reducing the time needed to analyze complex price data. The customizable nature of the indicator enables traders to adapt the tool to their specific trading style and preferences. With adjustable EMA periods, MACD settings, and table positioning, traders can fine-tune the indicator to match their individual trading strategies and market analysis approach.
When to explore it
This indicator is most effective in markets with clear trending characteristics, where moving averages can provide reliable signals about price direction and momentum. It works particularly well in liquid markets with consistent price movements, such as major currency pairs, stock indices, and large-cap stocks. Traders can use this tool across multiple timeframes, from short-term scalping to longer-term swing trading.
The indicator is especially useful during periods of market transition, where identifying trend changes early can provide significant trading advantages. By combining multiple technical indicators, it offers a robust approach to market analysis that can help traders make more informed decisions about entry and exit points, reducing the likelihood of trading based on incomplete or misleading information.
Keep exploring
What we’ve verified
Access, alerts and repainting behaviour have not been independently verified for this indicator. Check the creator’s current publication and settings.
General descriptions and classifications are recovered research. Verified details above identify the specific checks we have completed. Check the creator’s current publication for later changes.