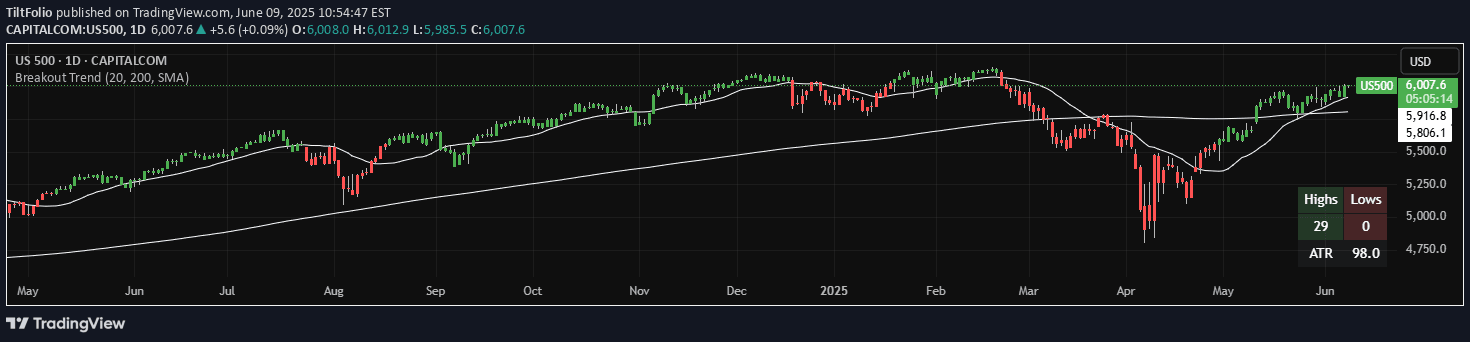
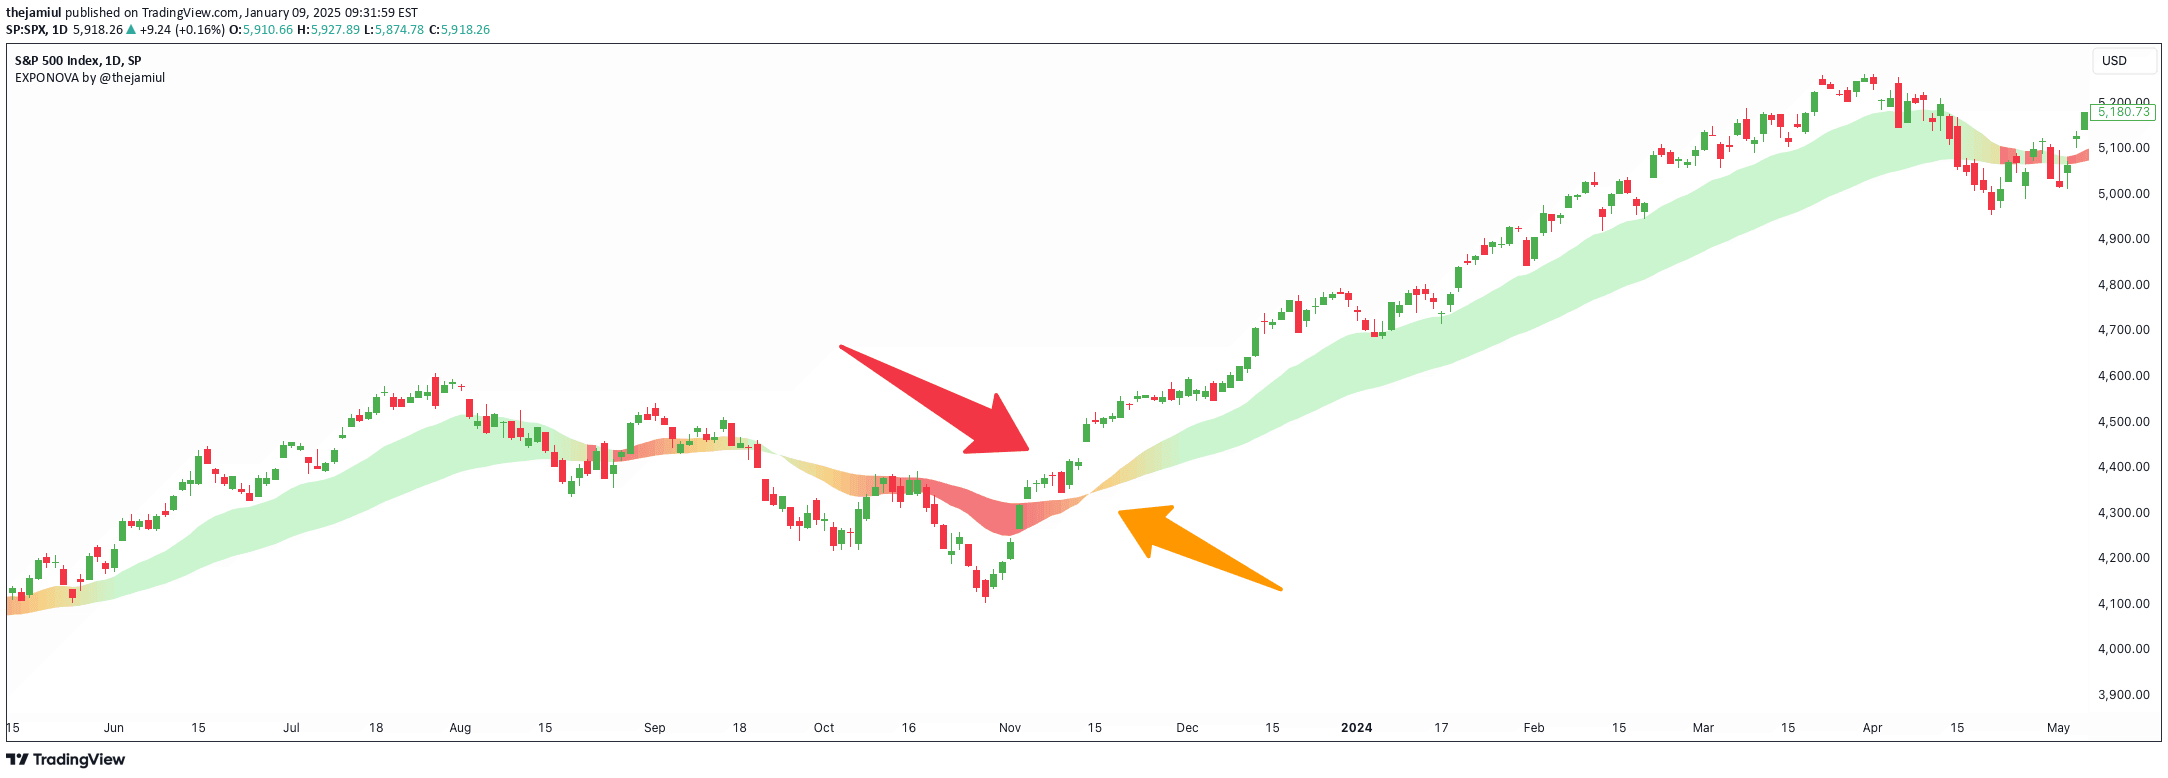
A trading indicator using EMA and RMA envelopes to determine trend strength, direction, and potential market shifts through cloud-based analysis of price movements.
Explore complementary indicator rolesHow it works
The indicator creates two dynamic clouds using exponential moving average (EMA) and relative moving average (RMA) by calculating highs and lows over a selected period. These clouds represent potential support and resistance zones, with the envelope's slope and alignment indicating market momentum and trend strength.
By utilizing high and low prices instead of just closing prices, the indicator provides a more comprehensive view of price action. The clouds help traders visualize market conditions, with horizontal alignment suggesting range-bound markets and steeper slopes indicating stronger directional trends.
Why it may be useful
This indicator helps traders understand market dynamics beyond traditional moving average techniques by revealing subtle price movement nuances and potential trend reversals. It eliminates common trader misconceptions about simple moving average crossovers and provides a more sophisticated approach to trend analysis.
The multi-layered cloud approach allows traders to see market maker manipulations and provides clearer signals about potential trend changes. By offering insights into market momentum, support/resistance levels, and trend strength, the indicator helps traders make more informed trading decisions across different market conditions.
When to explore it
The indicator works best during trending markets where clear directional movement can be observed, particularly when price is testing or breaking through the cloud boundaries. Traders should pay special attention when the price first returns after a cloud breakout, as this typically represents the most reliable entry point.
It is particularly effective when clouds are not too far apart, indicating a potentially strong trend, and when there are clear slope changes in the clouds. Traders should use additional confirmation signals and wait for the first retest after a significant move to validate potential trend changes or range formations.
Keep exploring
What we’ve verified
Access, alerts and repainting behaviour have not been independently verified for this indicator. Check the creator’s current publication and settings.
General descriptions and classifications are recovered research. Verified details above identify the specific checks we have completed. Check the creator’s current publication for later changes.