Andean Oscillator
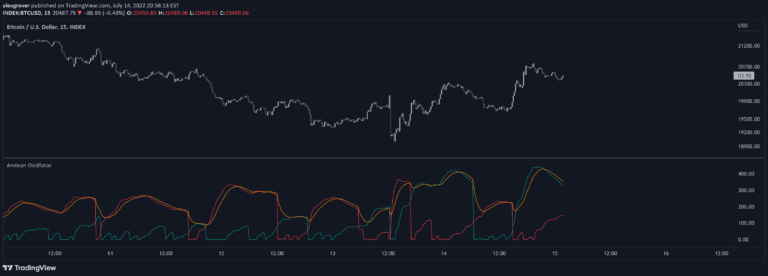
The Andean Oscillator is a trend analysis indicator that measures price variations by comparing bullish and bearish components to identify market direction and potential trend shifts.
Explore 11,183 indicators. Filter beyond the obvious.
Discover the tools that fit the way you trade.
11,183 tools to explore
The Andean Oscillator is a trend analysis indicator that measures price variations by comparing bullish and bearish components to identify market direction and potential trend shifts.
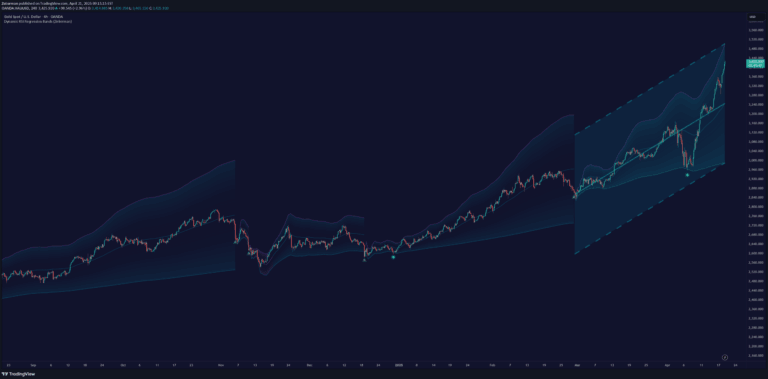
A dynamic trend-tracking indicator that identifies major trend shifts, maps price impulses, and quantifies trend strength through adaptive volatility envelopes and real-time percentage calculations.
A dynamic RSI-based regression channel that adapts to market momentum by resetting its trend analysis when RSI crosses overbought or oversold levels, revealing potential trend shifts.
A dynamic volatility-responsive trend engine that adapts to market structure, offering real-time directional bias and trend confirmation through adaptive range calculations and multi-type smoothing techniques.
An advanced market analysis tool that breaks down price data into intrinsic mode functions, revealing hidden market cycles and trends through adaptive signal processing.
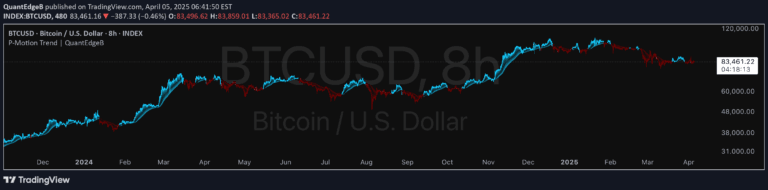
P-Motion Trend is an advanced trend-following indicator that uses DEMA filtering, percentile smoothing, and volatility-adjusted envelopes to detect market trends with minimal lag and high precision.
A sophisticated trend-following system that combines DEMA, Gaussian smoothing, and ATR-based envelopes to capture directional market bias with reduced noise and enhanced signal clarity.
Dynamic Envelope Based Supertrend combines volatility-adaptive envelopes with trend-following logic to generate precise trading signals by tracking price movements across different market conditions.
An adaptive indicator that dynamically calculates optimal trading lengths for multiple traditional indicators, allowing for more flexible and responsive market analysis across different timeframes.
A probability-based technical analysis indicator that calculates potential price movements using statistical methods, creating dynamic envelopes around current price to predict potential support and resistance levels.
Drummond geometry is a trading method using geometric patterns and moving averages to identify market trends, potential reversals, and key price levels through PLdots, envelopes, and energy points.
True Envelopes is an advanced price envelope indicator that dynamically tracks price movements using high-pass filtering and kernel density estimation to identify precise support and resistance levels.
Likes, views, and comments are historical TradingView snapshots. They describe attention, not trading performance.