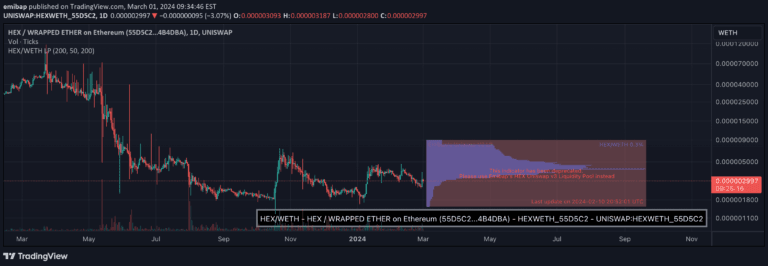
A histogram visualization of liquidity distribution for the HEX/USDC 3% pool, helping traders understand price sentiment and potential market movements.
Explore complementary indicator rolesHow it works
The liquidity histogram displays the concentration of liquidity across different price levels in the HEX/USDC pool. Each bar represents the volume of liquidity available at specific price ranges, with the width and height indicating the depth and distribution of liquidity.
Traders can visually interpret the histogram to understand where most liquidity is concentrated relative to the current market price. By showing the liquidity distribution, the tool helps traders identify potential support and resistance zones based on the pool's structural composition.
Why it may be useful
Understanding liquidity distribution is crucial for making informed trading decisions in decentralized markets. The histogram provides insights into potential price movements by revealing where market participants have positioned their capital and liquidity.
By analyzing the concentration of liquidity, traders can anticipate potential price reactions, identify areas of market interest, and gauge the overall market sentiment for the HEX/USDC trading pair.
When to explore it
This liquidity histogram is most effective when used on 4-hour, daily, or weekly timeframes for a comprehensive view of liquidity dynamics. Traders should pay special attention when the majority of liquidity is positioned below or above the current market price.
It is particularly useful during periods of market uncertainty or when looking to identify potential trend reversal points. The tool can help traders make more strategic entry and exit decisions by understanding the underlying liquidity structure of the market.
Keep exploring
What we’ve verified
Access, alerts and repainting behaviour have not been independently verified for this indicator. Check the creator’s current publication and settings.
General descriptions and classifications are recovered research. Verified details above identify the specific checks we have completed. Check the creator’s current publication for later changes.