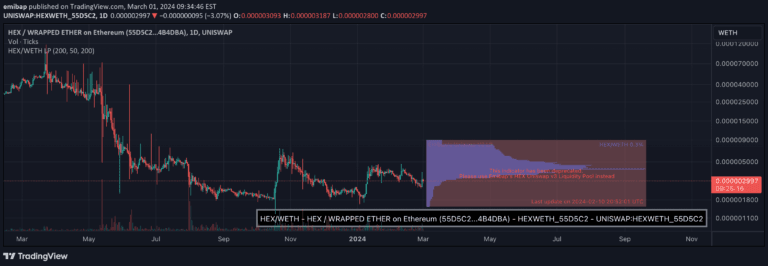
A histogram visualizing Uniswap V3 HEX liquidity pool across different token pairs, helping traders understand market sentiment and potential price movements.
Explore complementary indicator rolesHow it works
The HEX liquidity pool histogram displays the distribution of liquidity across different price ranges in the Uniswap V3 pool. It calculates the volume of tokens locked at various price levels, creating a visual representation of market depth. The histogram uses configurable parameters like color, background, and price limits to provide a customizable view of liquidity concentration.
Traders can adjust the upper and lower price limits relative to the current price, allowing for a focused analysis of liquidity around key price levels. The width of the bars can be modified to increase resolution, providing more detailed insights into the liquidity distribution.
Why it may be useful
The liquidity pool histogram offers crucial insights into market sentiment and potential price movements by revealing where significant token volumes are concentrated. By visualizing liquidity distribution, traders can identify areas of strong support and resistance, helping them make more informed trading decisions.
This tool provides a visual representation of market depth that goes beyond traditional price charts. Understanding liquidity concentration can help traders anticipate potential price barriers and momentum shifts. If most liquidity is positioned above or below the current price, it can signal potential future price movements and help traders develop more strategic entry and exit points.
When to explore it
This liquidity pool histogram is most effective when used on higher timeframes like 4-hour, daily, or weekly charts. It is particularly useful for HEX/WETH trading pairs, providing the most accurate insights when the price is expressed in WETH. Traders should use this tool to complement other technical analysis methods and gain a deeper understanding of market structure.
The histogram is especially valuable during periods of price consolidation or when seeking to understand potential support and resistance levels. Traders can use it to identify areas of high liquidity concentration and potential price inflection points, making it a powerful tool for both day trading and swing trading strategies.
Keep exploring
What we’ve verified
Access, alerts and repainting behaviour have not been independently verified for this indicator. Check the creator’s current publication and settings.
General descriptions and classifications are recovered research. Verified details above identify the specific checks we have completed. Check the creator’s current publication for later changes.