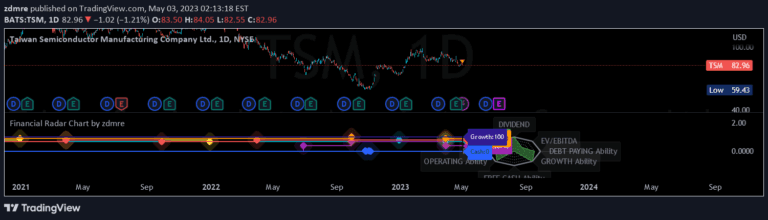
A trading signal that calculates a simple financial metric by dividing quarterly Earnings per Share by the stock's closing price to assess relative performance.
Explore complementary indicator rolesHow it works
The signal operates by taking the most recent quarterly Earnings per Share (EPS) and dividing it by the stock's closing price. This calculation provides a basic valuation metric that helps traders understand the relationship between a company's earnings and its current market price.
By comparing this ratio across different time periods or against other stocks, traders can gain insights into potential investment opportunities. The simplicity of this method allows for quick comparative analysis without complex mathematical modeling. Traders can use this signal as a preliminary screening tool to identify potentially undervalued or overvalued stocks based on their earnings relative to current market pricing.
Why it may be useful
This signal offers traders a straightforward method to assess a stock's fundamental valuation by relating its earnings directly to its market price. It provides a quick snapshot of how efficiently a company is generating earnings relative to its current stock value, which can be a crucial indicator of potential investment attractiveness.
By understanding this relationship, investors can make more informed decisions about potential entry and exit points. The metric helps traders compare stocks across different sectors and market capitalizations by normalizing earnings against stock price. This approach can reveal hidden opportunities where a company might be generating significant earnings but not yet fully recognized by the market's current pricing.
When to explore it
This signal is most effective when used as part of a comprehensive fundamental analysis approach, particularly for investors interested in value investing strategies. It works best when comparing stocks within the same sector or industry, where the earnings-to-price ratio can provide meaningful insights into relative performance. Traders should use this signal in conjunction with other financial metrics and market indicators.
The signal is particularly useful during earnings seasons when companies release their quarterly financial reports. By tracking how this ratio changes over time, investors can identify trends in a company's financial performance and potential market sentiment shifts. However, it should not be used in isolation but as one of multiple tools in a robust investment decision-making process.
Keep exploring
What we’ve verified
Access, alerts and repainting behaviour have not been independently verified for this indicator. Check the creator’s current publication and settings.
General descriptions and classifications are recovered research. Verified details above identify the specific checks we have completed. Check the creator’s current publication for later changes.