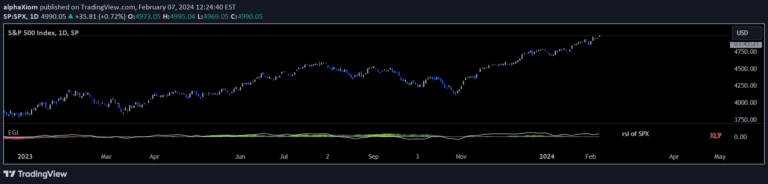
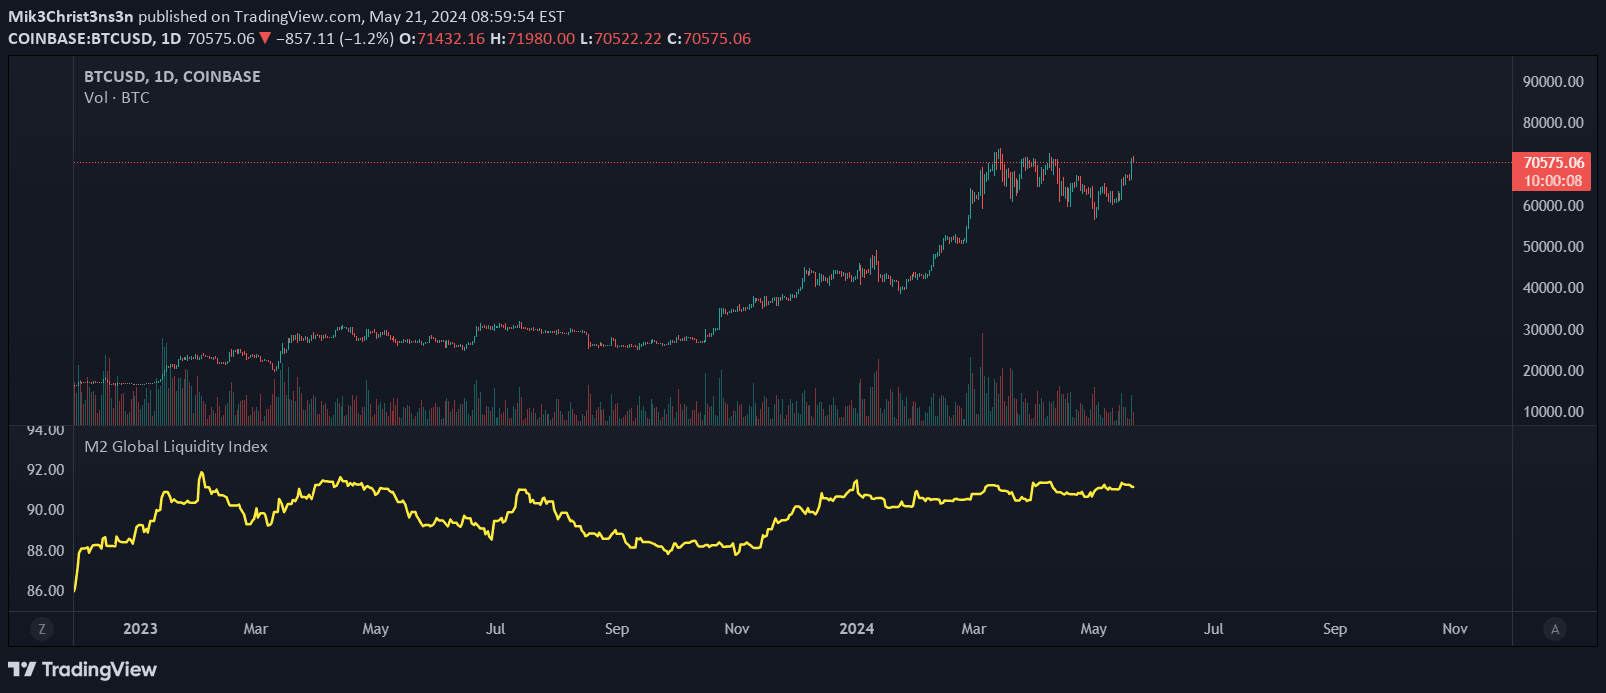
A macroeconomic indicator that aggregates four key economic factors to assess the United States' economic health and potential market momentum through a comprehensive growth index.
Explore complementary indicator rolesHow it works
The US Growth Momentum Index (UGMI) calculates Z-scores for four critical economic indicators: Industrial Production, Retail Sales, Unemployment Rate, and 10Y-2Y Yield Curve Spread. By standardizing these metrics, the index creates a normalized score that represents overall economic performance.
The aggregated score is plotted against a zero line, with values above zero indicating economic expansion and values below zero suggesting contraction. The index uses color coding and specific threshold zones to provide visual clarity, with green representing strong growth (above +1) and potential market peaks, and red signaling potential recession conditions (below -1).
Why it may be useful
The UGMI provides traders and investors with a comprehensive, multi-factor view of economic health beyond single-metric assessments. By combining diverse economic indicators, it offers a more holistic perspective on potential market trends and economic cycles, helping investors make more informed strategic decisions.
This indicator is particularly valuable for understanding broader economic momentum, allowing traders to anticipate potential market shifts, assess risk, and align their investment strategies with underlying economic conditions. Its Z-score methodology ensures that different economic factors are comparably weighted, providing a more balanced and nuanced economic analysis.
When to explore it
The UGMI is most effective for investors and traders focused on medium to long-term market trends, particularly those interested in macroeconomic analysis and strategic asset allocation. It is especially useful during periods of economic uncertainty or potential transition between market cycles.
Traders should pay close attention when the index approaches critical threshold zones (+1 or -1), as these points often signal significant changes in economic momentum. The indicator is particularly valuable for swing traders and investors who make decisions based on broader economic trends rather than short-term price fluctuations.
Keep exploring
What we’ve verified
Access, alerts and repainting behaviour have not been independently verified for this indicator. Check the creator’s current publication and settings.
General descriptions and classifications are recovered research. Verified details above identify the specific checks we have completed. Check the creator’s current publication for later changes.