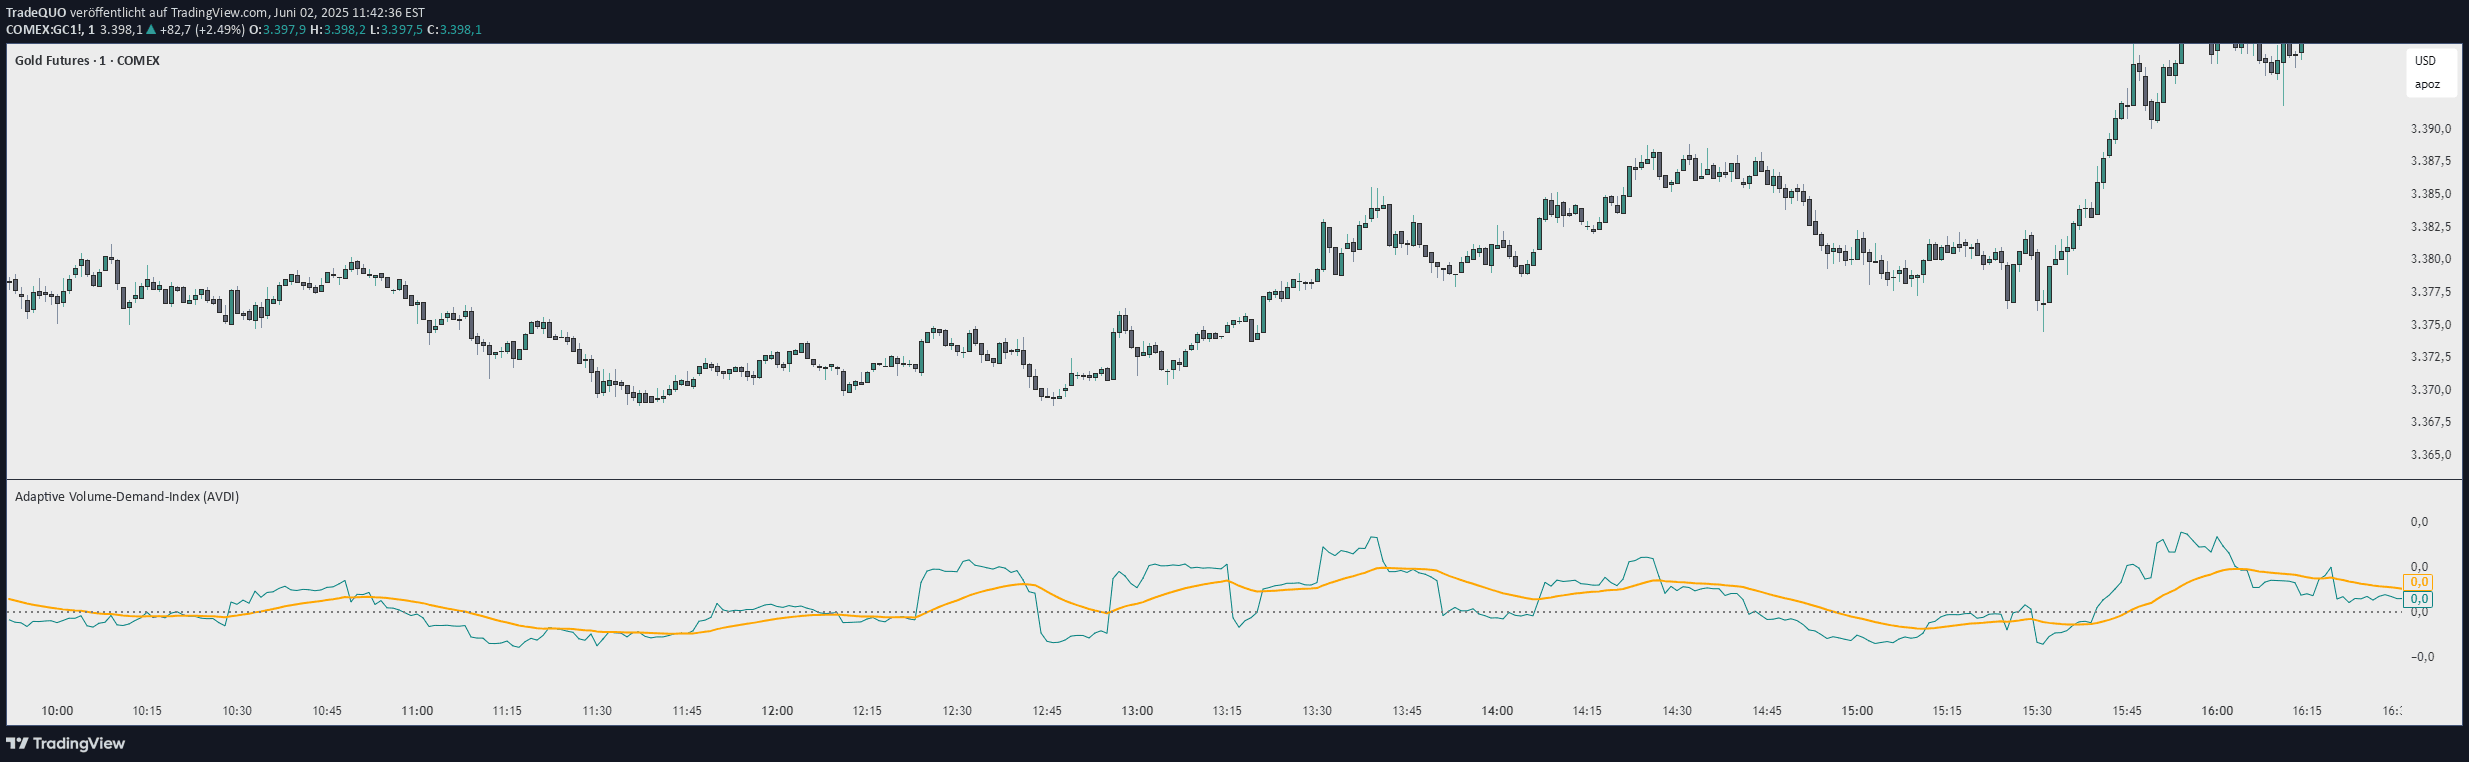
A volume-based indicator that identifies the bar with the largest volume in a specified lookback period and highlights the corresponding candlestick for analysis.
Explore complementary indicator rolesHow it works
The indicator systematically analyzes volume data within a predefined lookback period, typically set to 50 bars. It scans through the historical volume bars to identify the single bar with the largest numerical volume value. Once identified, the indicator highlights the corresponding candlestick on the chart, typically in a distinctive color like yellow.
The primary mechanism involves comparing volume values across multiple bars to determine the most significant volume spike. By focusing on the bar with the highest volume, traders can potentially identify key moments of market interest or significant price movements that may indicate important trading opportunities.
Why it may be useful
Volume is a critical indicator of market strength and potential price movements, providing insights into the conviction behind price actions. By highlighting the candlestick with the largest volume, traders can quickly identify periods of heightened market activity and potential trend confirmations or reversals.
This approach helps traders understand market dynamics by drawing attention to moments of significant trading interest. The visual highlighting makes it easier to spot potential entry or exit points, allowing traders to make more informed decisions based on volume-driven market sentiment.
When to explore it
The indicator is most effective in markets with clear volume patterns and during periods of significant price movement. It works best in liquid markets where volume can provide meaningful insights into market dynamics, such as stocks, futures, and forex trading.
Traders should use this signal in conjunction with other technical analysis tools to confirm potential trading signals. It is particularly useful for identifying potential trend changes, breakouts, or moments of increased market activity that might indicate important trading opportunities.
Keep exploring
What we’ve verified
Access, alerts and repainting behaviour have not been independently verified for this indicator. Check the creator’s current publication and settings.
General descriptions and classifications are recovered research. Verified details above identify the specific checks we have completed. Check the creator’s current publication for later changes.