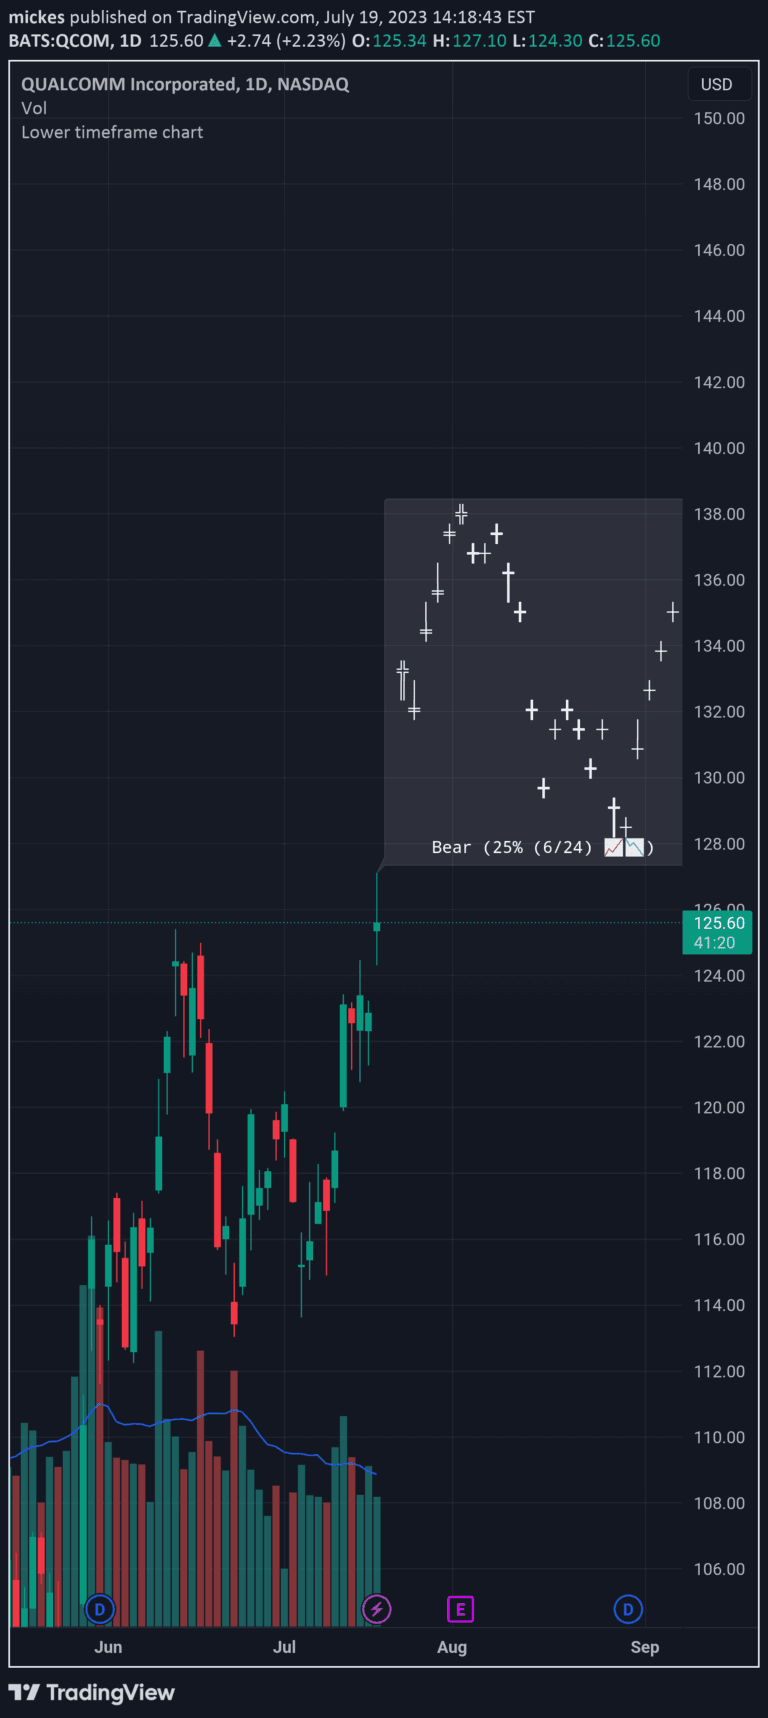
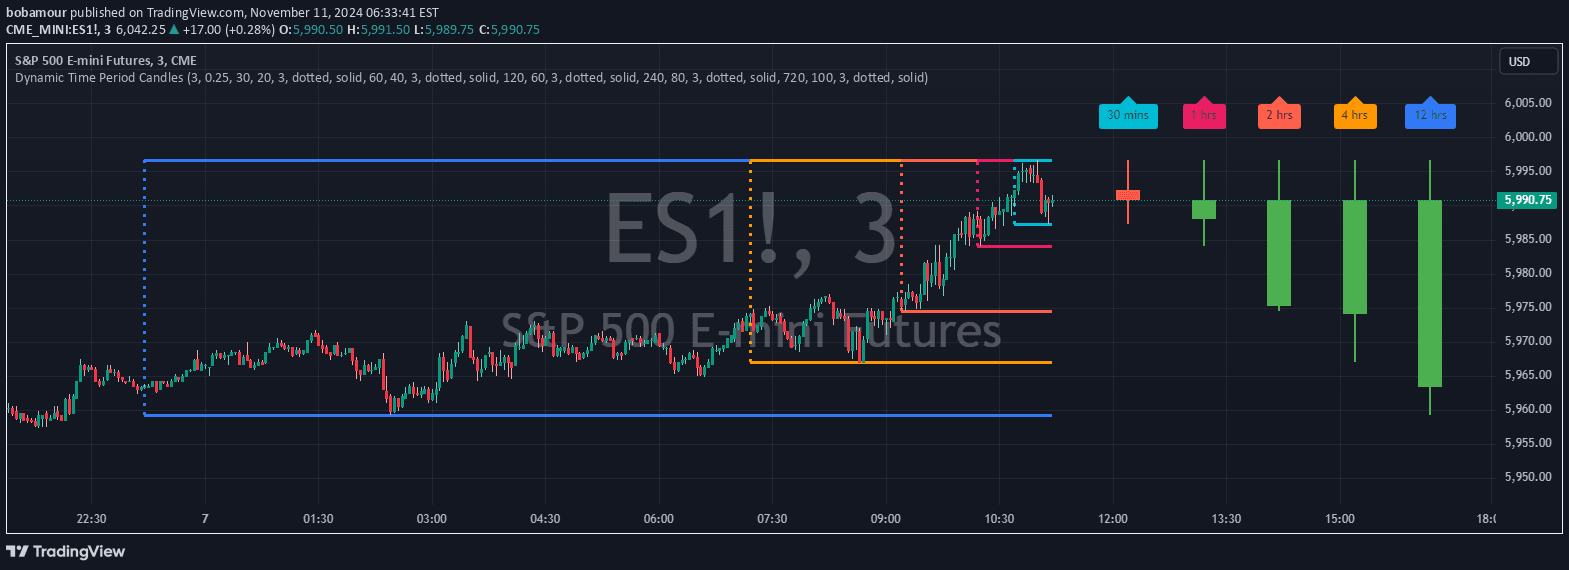
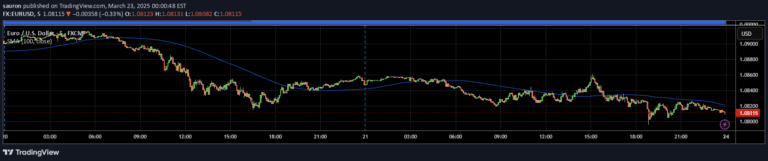
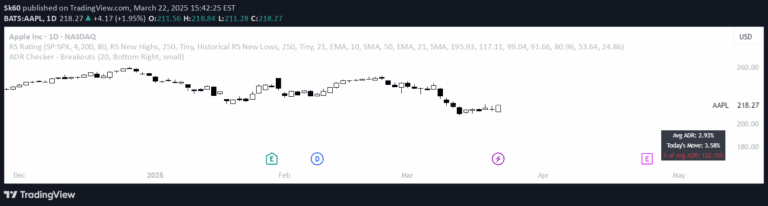
An indicator that plots expected security movement by calculating average price range over five periods, providing traders with visual insights into potential price fluctuations.
Explore complementary indicator rolesHow it works
The Expected Move Plotter calculates price movement by analyzing the open, high, and low values of the last five periods. It determines the average range between these price points to generate visual projections of potential price movement above and below the current open price.
The script uses time frame translations to adapt to different trading intervals, from 60 seconds to 12 months. By converting timeframes to milliseconds, it provides a flexible mechanism for plotting expected price ranges across various trading contexts.
Why it may be useful
Traders benefit from this indicator by gaining immediate visual insights into potential price fluctuations based on recent market behavior. It transforms complex price data into an easily interpretable format, helping traders quickly assess potential market movements and make more informed trading decisions.
The indicator's color-coded visualization - green or red - provides an intuitive representation of whether expected movement is above or below the current close, enabling traders to rapidly understand potential market dynamics without extensive manual calculations.
When to explore it
The Expected Move Plotter is most effective in markets with consistent price ranges and during periods of moderate volatility. It works best for traders seeking quick, visual representations of potential price movements across different time frames, from short-term scalping to day trading scenarios.
Traders should use this indicator as a supplementary tool alongside other technical analysis methods, recognizing that while it provides valuable insights, it should not be the sole basis for trading decisions. Its greatest utility lies in offering a rapid, graphical interpretation of recent price behavior and potential future movements.
Keep exploring
What we’ve verified
Access, alerts and repainting behaviour have not been independently verified for this indicator. Check the creator’s current publication and settings.
General descriptions and classifications are recovered research. Verified details above identify the specific checks we have completed. Check the creator’s current publication for later changes.