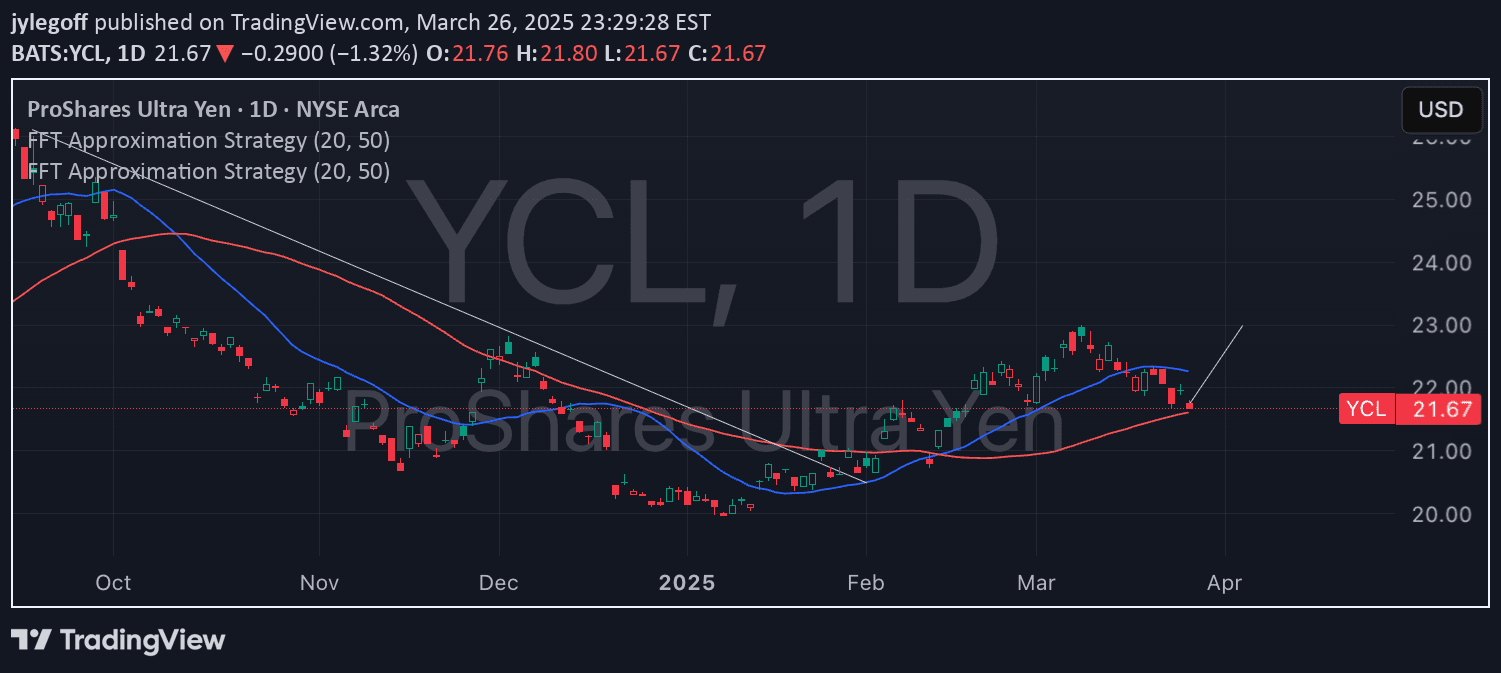
FFT Strategy analyzes USD/JPY price cycles using spectral analysis to identify optimal entry points by filtering market noise and tracking cyclical market behavior.
Explore complementary indicator rolesHow it works
The FFT Strategy uses Fast Fourier Transform (FFT) principles to decompose price movements into their fundamental frequency components. By analyzing these spectral components, traders can identify dominant market cycles in USD/JPY. The method separates high-frequency noise from low-frequency trends, helping to pinpoint more reliable trading signals.
Cycle identification involves mapping out recurring price patterns and their periodicity. Traders then use these insights to determine potential entry and exit points based on the predicted market rhythm. External FFT analysis provides a mathematical framework for understanding underlying market dynamics
Why it may be useful
FFT Strategy offers traders a sophisticated approach to understanding market behavior beyond traditional technical analysis. By breaking down price movements into frequency components, traders gain deeper insights into market cycles and potential turning points. This method helps reduce the impact of market noise and provides a more nuanced view of price dynamics.
It allows for more precise timing of trades by identifying underlying market rhythms. The approach bridges mathematical signal processing with financial market analysis, offering a unique perspective on price movement. Traders can potentially improve their decision-making by understanding these cyclical patterns
When to explore it
The FFT Strategy works best in markets with clear cyclical behaviors, such as forex pairs like USD/JPY. It is most effective during periods of stable market conditions with predictable price movements. Traders should apply this strategy when seeking to minimize market noise and focus on fundamental price cycles.
It is particularly useful for swing traders looking to capture multi-day price trends. The method requires sophisticated analysis and is more suitable for experienced traders comfortable with advanced mathematical techniques. Optimal results are achieved when combined with other technical and fundamental analysis tools
Keep exploring
What we’ve verified
Access, alerts and repainting behaviour have not been independently verified for this indicator. Check the creator’s current publication and settings.
General descriptions and classifications are recovered research. Verified details above identify the specific checks we have completed. Check the creator’s current publication for later changes.