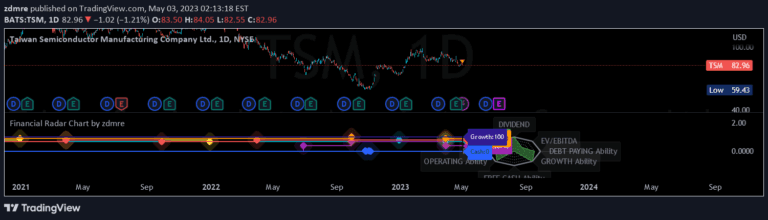
A financial data indicator designed to display comprehensive stock financial information across multiple years, allowing users to select and analyze key financial metrics.
Explore complementary indicator rolesHow it works
This financial data indicator provides a systematic approach to analyzing stock performance by allowing users to select up to four specific financial metrics. The tool aggregates financial data over an eight-year period, combining both annual and quarterly information to give traders a comprehensive view of a stock's financial health.
The indicator generates raw financial data across different time frames, with a special emphasis on quarterly breakdowns. Users can customize their analysis by selecting specific metrics, enabling a flexible and detailed examination of a stock's financial characteristics and performance trends.
Why it may be useful
Financial data indicators are crucial for investors seeking to make informed decisions based on comprehensive historical performance metrics. By providing a multi-year view of financial information, this tool helps traders understand the long-term financial trajectory of a specific stock and identify potential trends or patterns.
The ability to analyze both annual and quarterly data allows investors to gain deeper insights into a company's financial stability, growth potential, and overall economic performance. This comprehensive approach enables more nuanced and strategic investment decision-making.
When to explore it
This financial data indicator is most effective when conducting thorough fundamental analysis of a stock's performance. Investors looking to make long-term investment decisions will find the multi-year data particularly valuable for understanding a company's financial evolution and stability.
Traders should utilize this tool when researching potential investment opportunities, comparing different stocks, or conducting in-depth financial assessments. The quarterly breakdown makes it especially useful for identifying seasonal trends or cyclical performance patterns in a company's financial metrics.
Keep exploring
What we’ve verified
Access, alerts and repainting behaviour have not been independently verified for this indicator. Check the creator’s current publication and settings.
General descriptions and classifications are recovered research. Verified details above identify the specific checks we have completed. Check the creator’s current publication for later changes.