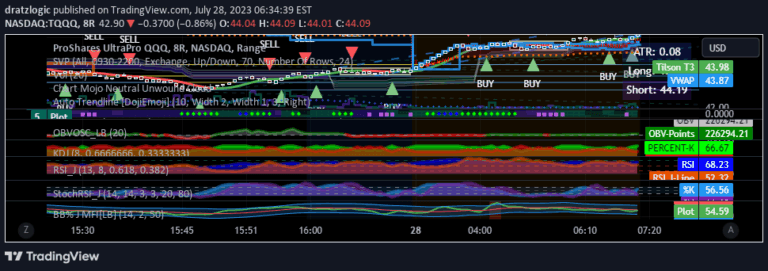
A dynamic RSI overlay that visualizes relative strength index values scaled to an anchor's range, providing enhanced insight into price movement and oscillation levels.
Explore complementary indicator rolesHow it works
The indicator begins by selecting an anchor point and collecting RSI values for each candle within a specific range. It systematically stores these values in an array corresponding to individual candle indices, creating a comprehensive data set of relative strength index measurements.
Once the data is collected, the tool scales the RSI values relative to the anchor's maximum and minimum range. It then plots a connected line representing these values on a 0-100 scale, visually mapping the RSI's progression and allowing traders to understand how price reacts at standard oscillation levels.
Why it may be useful
This RSI overlay provides traders with a more nuanced understanding of momentum and price behavior by contextualizing relative strength index movements within a specific range. By scaling and visualizing RSI values, traders can gain deeper insights into potential trend strength, reversals, and market sentiment.
The dynamic visualization helps traders identify critical momentum shifts and overbought or oversold conditions more effectively than traditional RSI indicators. Its unique approach of plotting RSI within a fixed scale enables more precise analysis of price movements and potential trading opportunities.
When to explore it
The indicator is most effective during periods of clear trend development or when seeking to understand momentum changes in volatile market conditions. Traders can utilize this tool when looking to confirm trend strength, identify potential reversal points, or assess the relative momentum of price movements.
It is particularly useful in fast-moving markets where quick identification of oscillation levels can provide a competitive edge. Scalpers and day traders will find this tool especially beneficial for making rapid, informed decisions about entry and exit points based on momentum signals.
Keep exploring
What we’ve verified
Access, alerts and repainting behaviour have not been independently verified for this indicator. Check the creator’s current publication and settings.
General descriptions and classifications are recovered research. Verified details above identify the specific checks we have completed. Check the creator’s current publication for later changes.