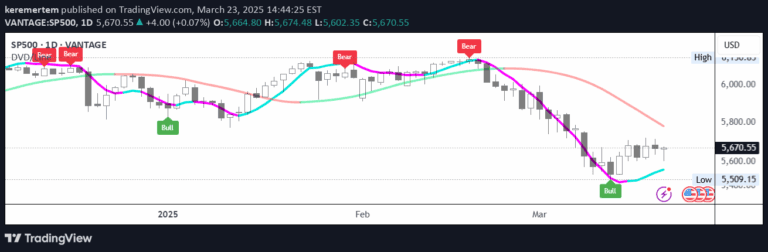
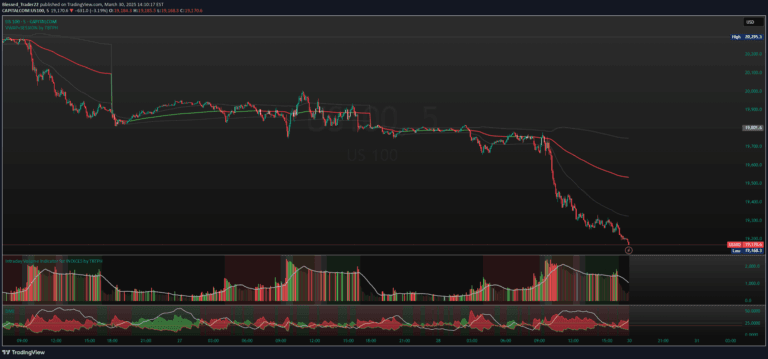
A technical indicator that uses Force Index and Force Volume Gradient to generate buy and sell signals based on momentum and volume interactions.
Explore complementary indicator rolesHow it works
The Force Volume Gradient (FVG) indicator starts by calculating the Force Index, which multiplies close price and volume to measure price movement energy. An exponential moving average (EMA) is then applied to the Force Index to create the FVG line, smoothing out its values and providing a more refined momentum indicator.
A signal line is created using a simple moving average (SMA) of the FVG. When the FVG line crosses above the signal line, it generates a buy signal, indicating potential upward momentum. Conversely, when the FVG line crosses below the signal line, a sell signal is triggered, suggesting potential downward price movement.
Why it may be useful
The Force Volume Gradient provides traders with a sophisticated tool that combines price movement and trading volume to generate meaningful trading signals. By integrating volume with price momentum, the indicator offers insights into the underlying strength of market trends and potential trend reversals.
This approach helps traders assess not just price direction, but the 'force' behind price movements, allowing for more informed trading decisions. The indicator's ability to generate clear buy and sell signals makes it particularly useful for traders seeking systematic entry and exit points in various market conditions.
When to explore it
The Force Volume Gradient is most effective in markets with clear momentum and significant trading volume, such as highly liquid stocks, major currency pairs, and active index futures. It performs best in trending markets where price movements are accompanied by substantial volume, providing more reliable signals.
Traders should consider using this indicator in conjunction with other technical analysis tools to confirm signals and reduce false positives. It is particularly suitable for short to medium-term trading strategies, with optimal performance on intraday and daily charts where volume data is most representative of market sentiment.
Keep exploring
What we’ve verified
Access, alerts and repainting behaviour have not been independently verified for this indicator. Check the creator’s current publication and settings.
General descriptions and classifications are recovered research. Verified details above identify the specific checks we have completed. Check the creator’s current publication for later changes.