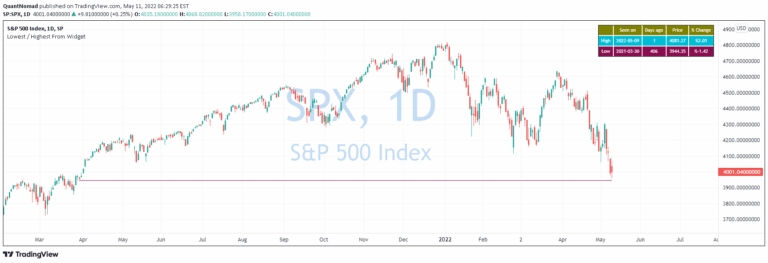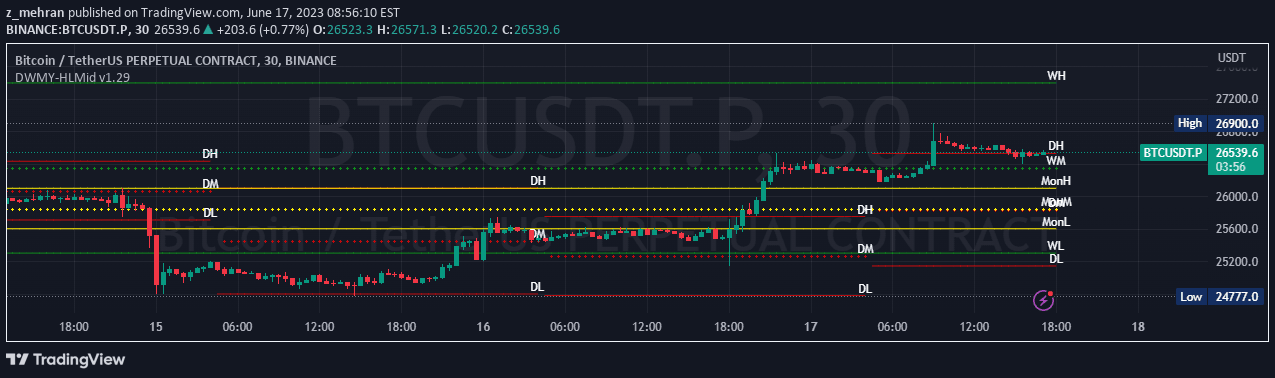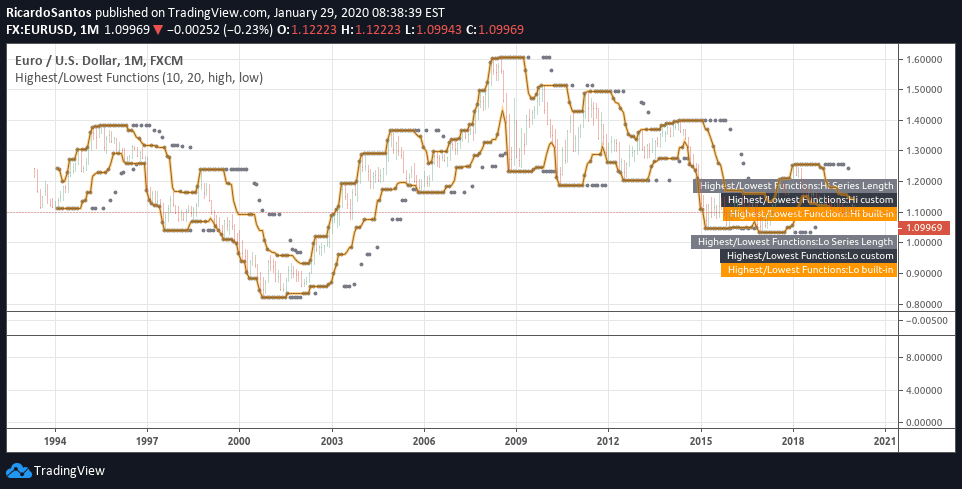
Highest() and lowest() functions analyze price data to identify extreme points within a specified range, helping traders detect peak and trough levels in market price movements.
Explore complementary indicator rolesHow it works
The highest() function finds the maximum value within a specified number of bars, scanning through price data to identify the peak price point. Similarly, the lowest() function determines the minimum value within the same range. These functions work by comparing current and previous values, tracking the highest high or lowest low across a defined period.
Traders can apply these functions to different price inputs like close, open, high, or low prices. The comparison is done sequentially, allowing dynamic tracking of price extremes. These functions are particularly useful in creating custom indicators or developing trading strategies that rely on identifying significant price levels
Why it may be useful
Highest() and lowest() functions provide critical insights into market dynamics by revealing key price extremes. They help traders identify potential support and resistance levels, which are crucial for making informed trading decisions. These functions enable precise detection of historical peaks and troughs, supporting trend analysis and entry/exit point identification.
By understanding price range boundaries, traders can develop more robust trading strategies. The functions offer flexibility in analyzing different timeframes and price types, making them versatile tools for technical analysis. They can be integrated into various trading indicators and strategies to enhance market interpretation
When to explore it
These functions are most effective in trending markets with clear directional movements. They work best when analyzing historical price data to identify potential future support and resistance levels. Traders can utilize highest() and lowest() functions during range-bound markets to detect price extremes and potential breakout points.
They are particularly useful in swing trading and trend-following strategies. The functions can help confirm trend strength and potential reversal points. Implementing these functions across multiple timeframes can provide a comprehensive view of price dynamics. Traders should combine these functions with other technical indicators for more robust analysis
Keep exploring
What we’ve verified
Access, alerts and repainting behaviour have not been independently verified for this indicator. Check the creator’s current publication and settings.
General descriptions and classifications are recovered research. Verified details above identify the specific checks we have completed. Check the creator’s current publication for later changes.