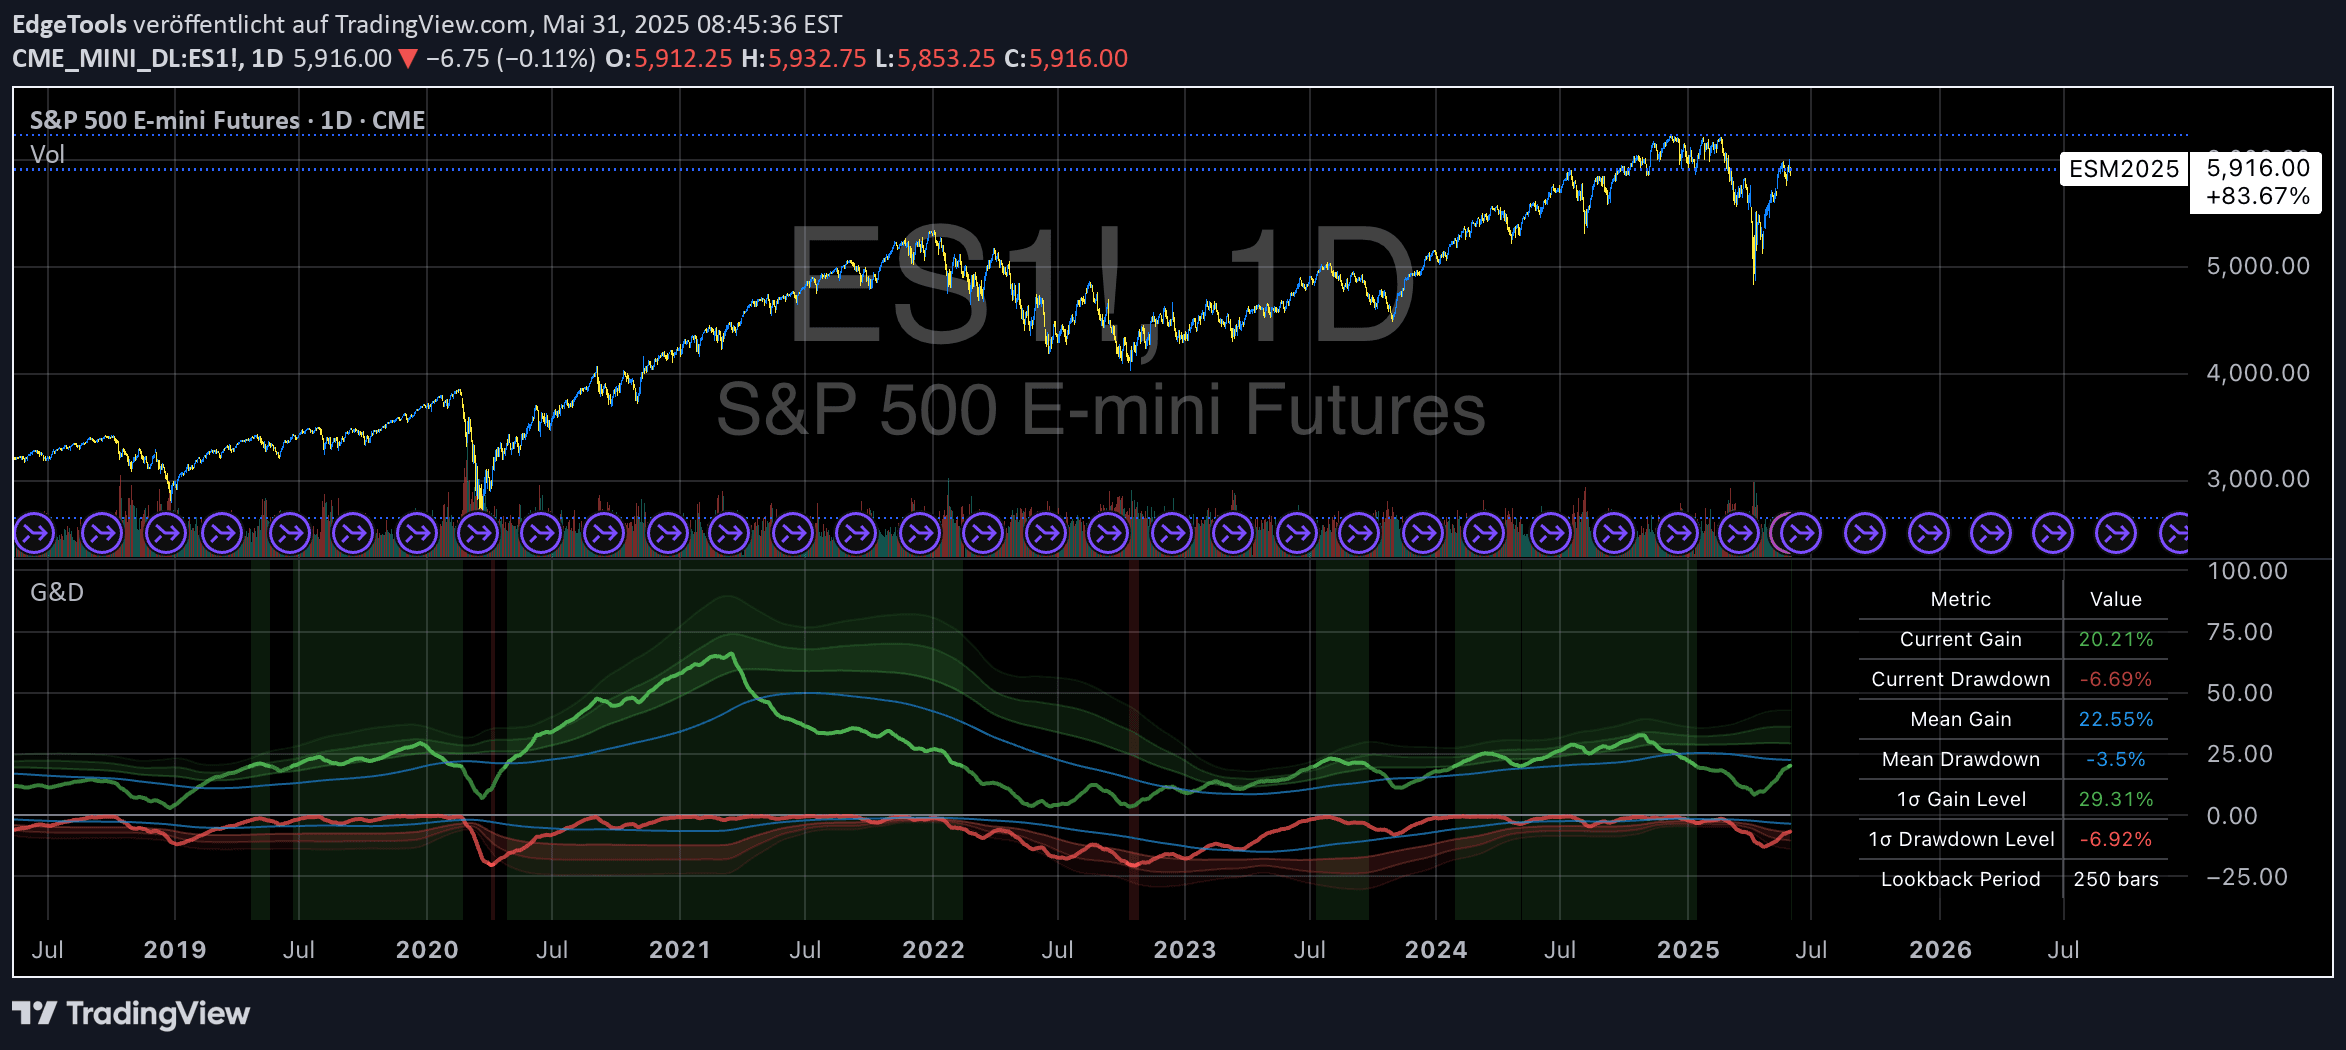
A comprehensive indicator analyzing market gains and drawdowns using standard deviation to visualize price movements, risk levels, and potential extreme market events.
Explore complementary indicator rolesHow it works
The indicator calculates percentage gains from the lowest price and drawdowns from the highest price within a specified lookback period, typically 250 days. It tracks these metrics by computing standard deviations, which quantify the volatility and range of price movements.
By plotting three standard deviation bands for both gains and drawdowns, the indicator provides a visual representation of price behavior. These bands help traders understand the normal volatility range and identify when price movements deviate significantly from historical patterns, highlighting potential market turning points or extreme events.
Why it may be useful
This indicator is crucial for traders and portfolio managers seeking to understand market risk and price dynamics comprehensively. By quantifying gains, drawdowns, and volatility, it provides a scientific approach to analyzing market behavior, enabling more informed decision-making.
Based on Modern Portfolio Theory, the indicator helps optimize risk management by revealing how price movements relate to historical volatility. It allows traders to systematically evaluate market conditions, identify potential extreme events, and make data-driven strategies that balance risk and potential returns.
When to explore it
The indicator is most effective during periods of significant market volatility or when evaluating long-term market trends across different asset classes. It works best when applied to markets with established historical data, allowing for accurate standard deviation calculations and meaningful comparisons.
Traders should utilize this signal when seeking to understand underlying market dynamics, assess portfolio risk, or identify potential turning points in price movements. It is particularly valuable during market transitions, economic events, or when analyzing multi-timeframe market behaviors.
Keep exploring
What we’ve verified
Access, alerts and repainting behaviour have not been independently verified for this indicator. Check the creator’s current publication and settings.
General descriptions and classifications are recovered research. Verified details above identify the specific checks we have completed. Check the creator’s current publication for later changes.