
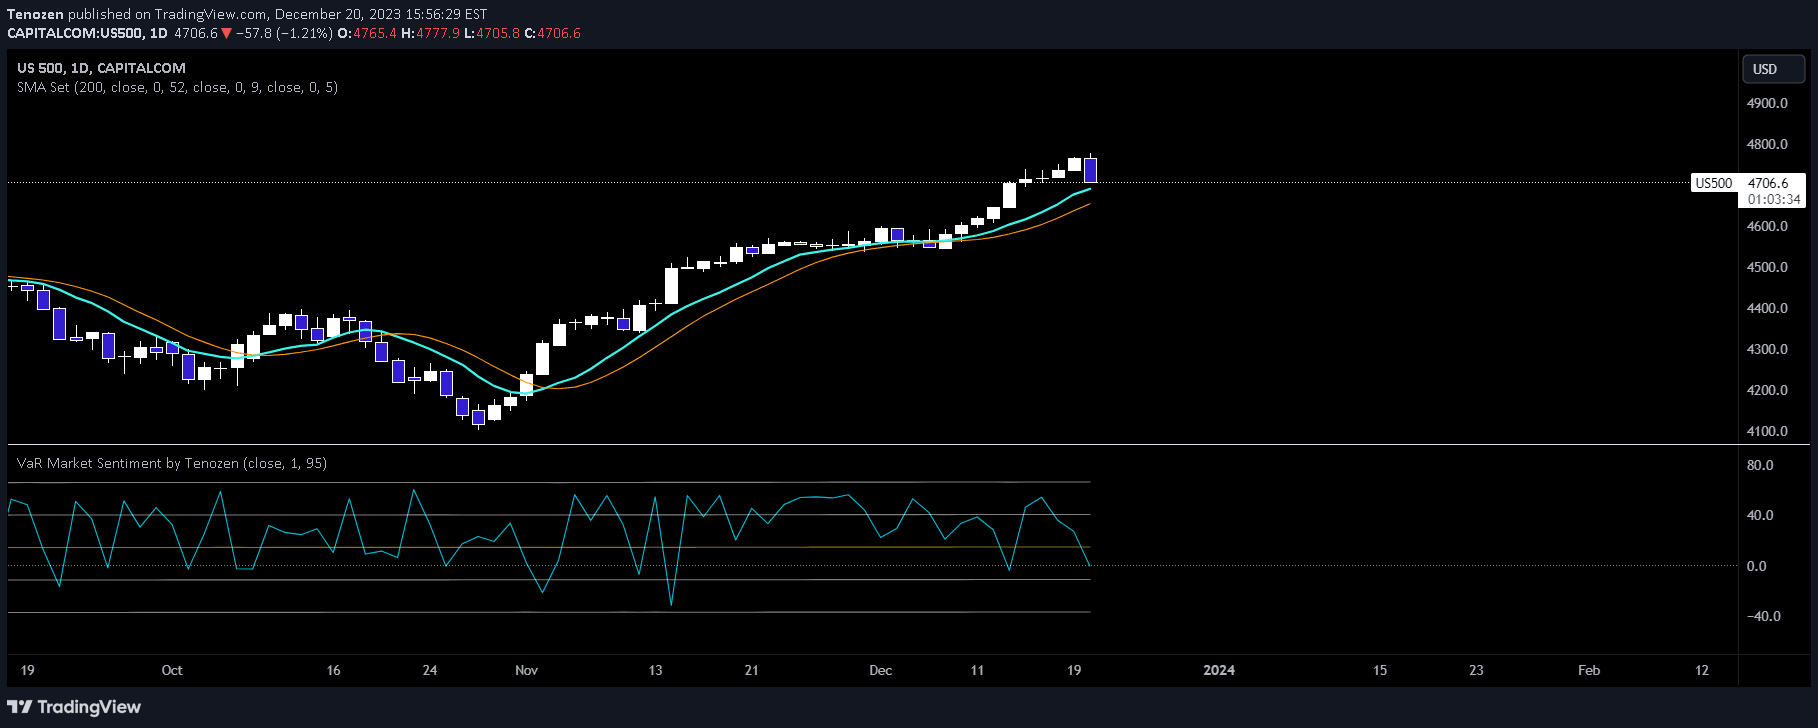
VaR Market Sentiment is an advanced trading indicator that uses Value at Risk to assess market movement strength and potential price direction based on historical returns.
Explore complementary indicator rolesHow it works
The VaR Market Sentiment indicator calculates market movement strength by comparing historical Value at Risk (VaR) with current market returns. It uses the 95th percentile confidence level to determine potential market movements, analyzing both bullish and bearish scenarios.
By subtracting VaR values from current returns, the indicator identifies candle strength. When the result is above the mean, the current candle is considered weak, and when below the mean, the candle is potentially strong. The deviation helps traders recognize critical market sentiments and potential price directions.
Why it may be useful
The VaR Market Sentiment indicator provides traders with a sophisticated method to assess market volatility and potential price movements. By quantifying market risk and sentiment, traders can make more informed decisions about potential trade entries and exits.
This approach offers a unique perspective on market dynamics, helping traders understand the underlying strength or weakness of price movements. It allows for a more nuanced interpretation of market conditions beyond traditional technical analysis methods.
When to explore it
The VaR Market Sentiment indicator is most effective when used in conjunction with other trend-following or mean reversion indicators. It works best in markets with sufficient historical data and consistent trading patterns.
Traders should apply this indicator across different timeframes, from scalping to swing trading, to gain insights into potential market movements. It is particularly useful during periods of market uncertainty or when seeking to understand the underlying strength of price action.
Keep exploring
What we’ve verified
Access, alerts and repainting behaviour have not been independently verified for this indicator. Check the creator’s current publication and settings.
General descriptions and classifications are recovered research. Verified details above identify the specific checks we have completed. Check the creator’s current publication for later changes.


