
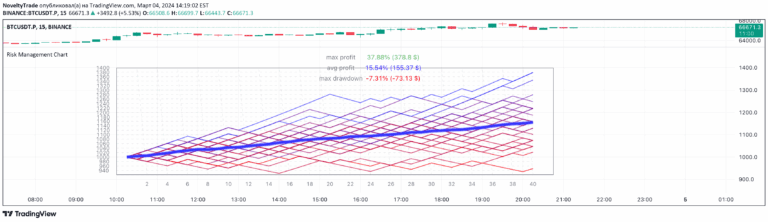
Risk Management Chart
A trading tool that simulates random trades and visualizes risk management strategies by generating multiple trade scenarios with different win/loss probabilities and equity calculations.
Explore 11,183 indicators. Filter beyond the obvious.
Discover the tools that fit the way you trade.
11,183 tools to explore
A trading tool that simulates random trades and visualizes risk management strategies by generating multiple trade scenarios with different win/loss probabilities and equity calculations.
A multi-signal RSI indicator that provides six different entry and exit strategies based on Relative Strength Index movements, helping traders identify potential trading opportunities.
A position sizing calculator that helps traders manage risk by determining optimal trade size, stop loss, take profit, and risk-reward ratio based on account parameters.
VaR Market Sentiment is an advanced trading indicator that uses Value at Risk to assess market movement strength and potential price direction based on historical returns.
A dynamic risk management tool that uses VWAP and standard deviation to calculate precise position sizes and stop-loss levels for intraday trading strategies.
An ATR-based indicator that visually displays stop-loss ranges by creating a volatility-adjusted zone above or below price, helping traders set dynamic risk management levels.
Likes, views, and comments are historical TradingView snapshots. They describe attention, not trading performance.